The success of our business depends on the health of our planet. We strive to minimize our impacts on the environment while proactively investing in the long-term resilience and reliability of our most essential resource—water.
No single ESG topic stands alone. To protect our planet, we must understand the complex connections between relevant ESG topics and take a cross-functional approach to effectively manage the associated risks of a changing landscape.
Taking a Holistic Approach
Each of the following inextricably linked areas of focus play a role in our strategies for delivering a sustainable supply of safe, affordable water to our communities while reducing our environmental footprint:
Managing Water Supply—Effectively managing changes in water availability and demand, particularly those driven by climatic events, including impacts to snowpack, rain-based surface water, and groundwater levels, plays a significant role in our ability to secure a sustainable supply of water for our customers, now and for generations to come.
Increasing System Efficiency and Reducing Water Consumption—By focusing on extending the efficiencies of our water system and reducing consumption at the customer’s tap, we believe we can reduce the energy required to produce and deliver water and, in turn, support a sustainable water supply while reducing our carbon footprint.
Environmental Stewardship—Reducing the negative environmental impacts of our operations supports a healthier planet, protects the watersheds from which we source our water, and helps preserve and improve water quality.
Underlying each of the above focus areas are three cross-cutting imperatives that demand an interdisciplinary set of solutions and a balance of priorities:
Mitigating Climate Change—The energy we consume to provide water and wastewater services to our customers contributes, in part, to climate change. We work to reduce the carbon footprint of our operations by lowering energy demand through customer conservation measures and by increasing system efficiency and transitioning to carbon-free energy sources in our operations.
Adapting to Climate Change—Climate change increases the risks associated with rising temperatures, drought, and extreme weather events that may affect the reliability of our systems and the availability of our water supply. To help us prepare for these risks to our business, we rely on our water supply management efforts, conservation programming, and strategic investments in operational and infrastructure resiliency.
Promoting Affordability—Balancing the cost of delivering a reliable supply of safe, high-quality water with our commitment to water affordability is an ongoing challenge in the face of climate change. To help preserve the affordability of our services, with an emphasis on affordability for low-income communities, we seek to focus on what we believe are the most needed water system improvement projects while also considering operational efficiency, rate design, grant opportunities, and conservation programs.
Providing a Sustainable Supply of Safe, Affordable Water
No single ESG topic stands alone, so we continue our work to understand and leverage the interconnections between them to provide a sustainable supply of safe, affordable water service for our customers.
Imperatives:
Mitigating Climate Change
Adapting to Climate Change
Promoting Affordability
Strategies:
Managing Water Supply
Increasing System Efficiency and Reducing Water Consumption
Environmental Stewardship
Planning for a Sustainable Future
We use a series of interrelated planning processes and reports to support our water resource and environmental sustainability efforts, conducting them on a recurring basis to help inform adjustments to our approach as the risk landscape evolves. While these formal plans and studies are developed primarily for our Cal Water subsidiary, some are also used in our other subsidiary states, and we intend to extend this work further in those states in the future.
The climate study analyzes climate-related vulnerabilities in our facilities, operations, and water supply portfolio at the district level. The results show how risks may change over time based on different emissions scenarios and provide a framework for future mitigation and adaptation planning.
Water Supply and Demand Assessment
Required
Annually evaluates water supply status and identifies any potential shortages and response actions, including implementation of the Water Shortage Contingency Plan.
UWMPs provide critical information for our service areas, including historical and projected water demands, water supplies, supply reliability, potential vulnerabilities, water shortage contingency planning, and demand management programs. Every five years, California requires that we complete UWMPs for service areas where we meet the definition of an urban retail water supplier. However, we choose to complete these plans for all service areas in order to promote effective water management.
WSCPs are included as appendices to our UWMPs and are developed every five years. These plans outline appropriate responses during water supply shortages and interruptions to protect health and safety, minimize economic disruption, and preserve environmental and community assets.
Conducted on a five-year cycle, these conservation plans evaluate and review forward-looking conservation efforts at the district level. These plans are also appendices of UWMPs.
Water Supply Reliability Plans/Studies
Voluntary
These plans evaluate the reliability of existing regional water supplies and assess supply and demand options to enhance future reliability. These reports also include water supply project recommendations for our facilities’ master planning processes.
Water Supply and Facilities Master Plans
Required
Informed by our water supply strategy, these plans forecast potential infrastructure needs at the district level and support long-term operational reliability.
Climate Change
As our communities experience the consequences of climate change, we strive to identify, mitigate, and adapt to critical climate-related impacts—and implement governance structures to oversee our short- and long-term sustainability strategies.
Understanding Climate Change Risks and Impacts
Adhering to a Process
Several years ago, we embarked on a multi-year journey to identify and assess climate-related risks throughout our operations in California, which represents the majority of our business. As we advance on that journey, we intend to continue to expand the scope of our assessments, account for evolving climate science, integrate projects into our rate cases to act on our findings, and prepare for the range of climate futures that we may encounter.
As part of our initial climate change evaluation in 2016, we developed a model designed to statistically estimate the variation in water demand attributable to changes in water rates, personal income, weather, demographics, passive and active conservation programs, and economic conditions. This model was then used to make a forecast of expected water demand conditional upon assumed long-term temperature and precipitation changes associated with climate change. An additional component of the 2016 study included a detailed review of water source vulnerabilities in 14 Cal Water districts, representing 85% of Cal Water’s 2014 water production and reflecting a wide variety of geographies and hydrologic systems.
In 2020, we completed Phase 1 of a more comprehensive climate change study, the Water Resources Monitoring and Adaptation Plan. This analysis, which researched the landscape of studies and resources available to help inform an assessment of climate-driven risks relevant across Cal Water facilities, operations, and water supply portfolio, served as a literature review to inform the second phase of the climate change study.
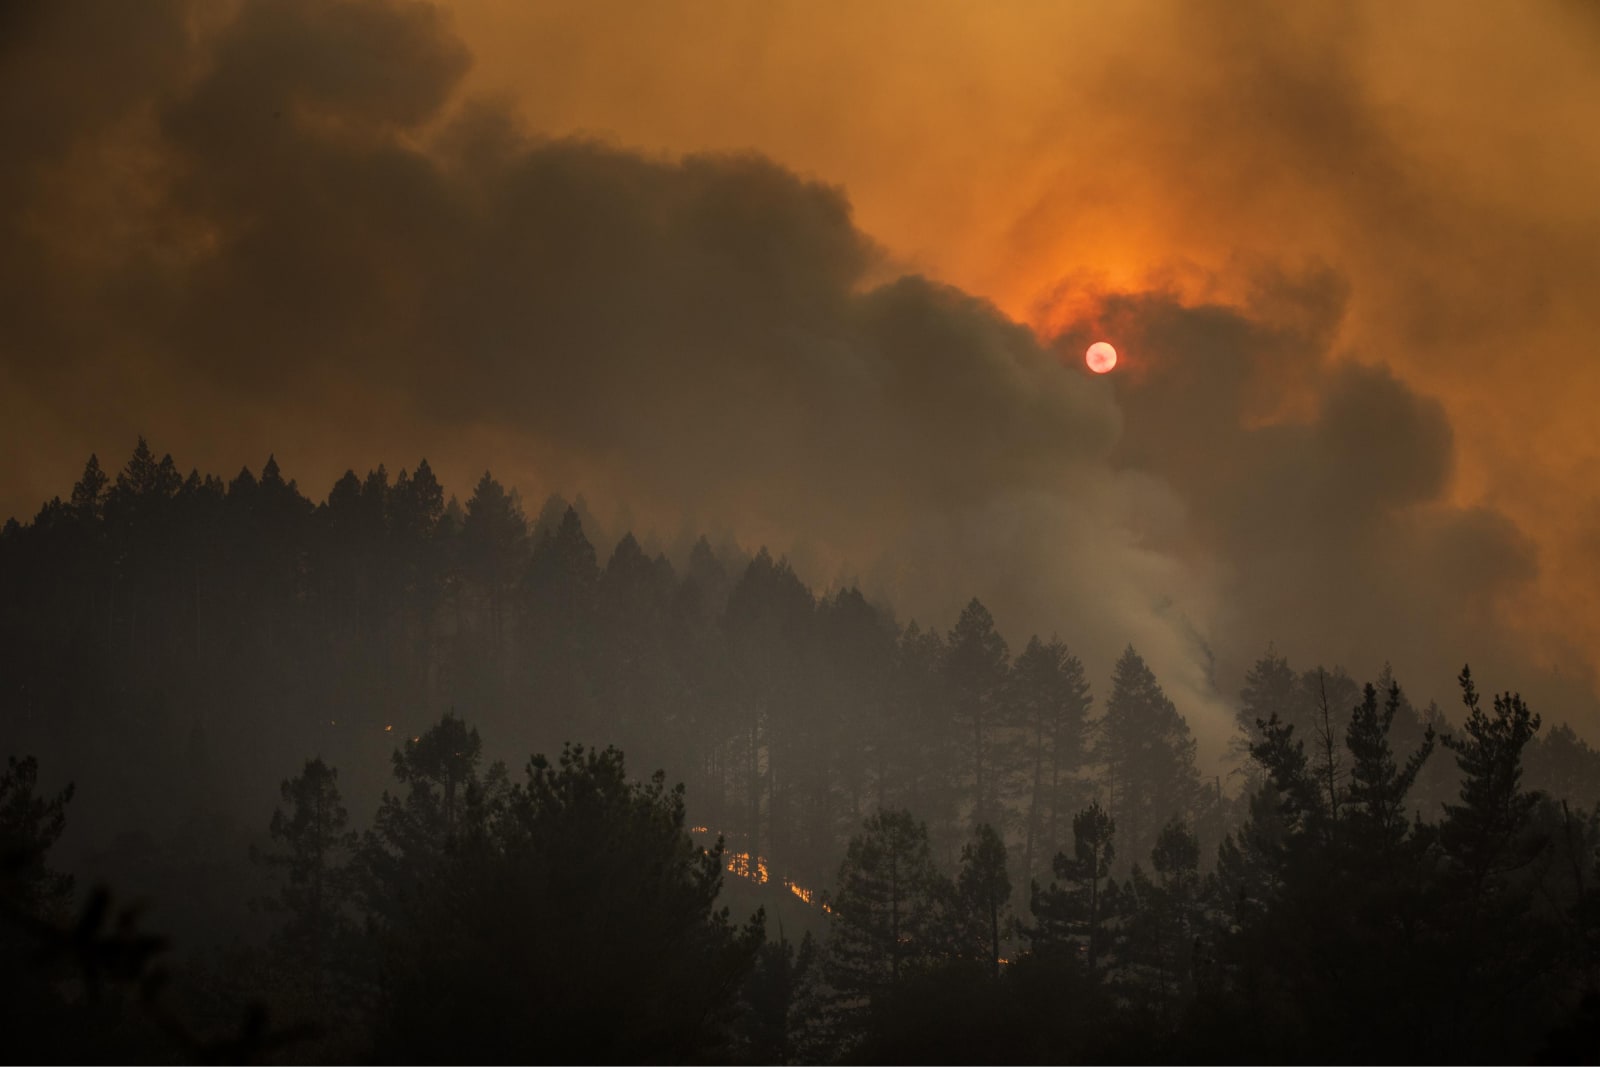
Recognizing the increased wildfire risks exacerbated by climate change, we also took the critical step of completing a Wildfire Risk Assessment for Wildfire Hardening in 2020. This assessment mapped high-risk areas of Cal Water operations, identified potential issues, and recommended measures to better prepare system facilities and enhance resiliency in the event of widespread wildfire.
Key Climate Risk Assessment Milestones
2016
Initial assessment of the impacts of climate change on water demand and water supply
2020
Phase 1 of Climate Change Study: Water Resources Monitoring and Adaptation Plan
Wildfire Risk Assessment for Wildfire Hardening
2021-2022
Phase 2 of Climate Change Study: Climate Change Risk Assessment and Adaptation Framework
Water Supply Reliability Assessment
These foundational assessments informed Phase 2 of our climate change study in 2021. The outcome of this second phase of work, our Climate Change Risk Assessment and Adaptation Framework, identified certain climate-related risks and opportunities that could impact our business over three distinct time horizons. The time horizons considered in our analysis included the following:
The early century horizon (2016–2045) includes near-term vulnerabilities and adaptation measures to consider for immediate implementation.
The mid-century horizon (2035–2064) covers longer-term capital investments, such as new facilities constructed after the lifespan of current infrastructure.
The late century horizon (2070–2099) evaluates long-term adaptation pathways.
Climate projections for each of the 30 years in each time horizon were averaged to account for natural climate variability across shorter time periods. Additionally, following guidance from the TCFD and Intergovernmental Panel on Climate Change (IPCC), we leveraged Representative Concentration Pathways (RCPs) in our analysis to consider climate risks across a range of possible climate futures. RCPs are scenarios that show trajectories of atmospheric greenhouse gas concentrations dependent on different timeframes and emission levels. Based on findings from Phase 1 of our climate change study and the associated literature review, we selected the following RCPs for our risk analysis:
RCP 4.5 is an intermediate scenario that assumes an estimated global temperature rise between 2˚C and 3˚C from pre-industrial levels by 2100, with anthropogenic global greenhouse gas emissions peaking in 2040.
RCP 8.5 is a high-emissions scenario that assumes temperature increases of at least 4˚C from pre-industrial levels by 2100, with anthropogenic global greenhouse gas emissions continuing to rise over the next century.
Wildfires pose an ever-increasing threat to surface water supplies and worker health and safety.
The assets and operations vulnerability assessment leverages the framework in the 2020 California Adaptation Planning Guide, which includes three key elements of vulnerability: exposure, sensitivity, and adaptive capacity. Exposure refers to systems, populations, or assets in areas that make them subject to direct harm; sensitivity is the degree to which a system may be impacted; and adaptive capacity is the ability to prepare for and respond to potential consequences or opportunities.
We evaluated risks at a district level to determine the key risks for each district related to supply reliability and operational assets. We also considered the impacts on Disadvantaged Vulnerable Communities (DVCs), which are often disproportionately exposed to climate hazards and have a lower capacity to adapt to these hazards. We believe the findings of the Climate Change Risk Assessment and Adaptation Framework provide actionable insights and a reliable framework for future planning. By using this tool, we intend to continue to implement programs that capitalize on these adaptation strategies.
In parallel with the broader-focused Climate Change Risk Assessment and Adaptation Framework, in 2021 and 2022 we also conducted a deeper review of the impacts of climate change and other environmental factors on water supply reliability and water quality for 10 Cal Water treatment plants. This study, the Water Supply Reliability Assessment, included an evaluation of climate-driven risks, development of recommendations to prioritize certain sources and facilities for further review, and identification of potential mitigation measures. Subsequent work in this multi-phase process is expected focus on higher-risk facilities and to provide evaluations to further inform risk mitigation measures and adaptive planning.
Predicting Potential Outcomes
Without proper preparation, physical climate-related risks are more likely to damage assets, disrupt operations and services, and impact supply and demand of water over the short, medium, and long term. While the severity of specific risks may vary across climate scenarios and over a range of time horizons, the following graph summarizes the climate-related risks for Cal Water that were identified in the Climate Change Risk Assessment and Adaptation Framework.
In particular, DVCs are often especially exposed to climate risks and face challenges in preparing for and recovering from risk events. We identified Cal Water districts serving a large proportion of DVCs and found that climate risks are particularly prevalent for DVCs in Cal Water districts with limited water supply diversity. Some of the top identified climate-related risks to DVCs include water shortage risk due to variations in water supplies and more frequent and severe droughts, elevated contamination risk due to increased wildfires, reduced precipitation, and increasing temperatures. These risks may compound existing health or economic issues in vulnerable communities.
Risks by Time Horizon
Present
2030
20502100
Asset
More frequent and severe riverine flooding could result in service disruption and infrastructure damage
Increased wildfire risk could damage all of Cal Water’s asset types
Sea level rise in the near term could result in permanent inundation of several asset types, especially pressurized mains
Rising groundwater may damage wells and treatment facilities
Uneven, ground level sinking in high subsidence areas could physically damage wells, pipelines, and treatment plants
Operations
High temperatures and low rainfall may decrease water quality
Increased wildfire risk may endanger worker health and safety
Increased wildfire risk and frequency of intense rainfall may decrease water quality
High temperature and resulting safety procedures may result in decreased safety and productivity
Increased algal blooms could result in contaminants that reduce water quality
Declining snowpack due to temperature increases may result in natural snowpack storage decreases
SUPPLY/DEMAND
Due to snowpack changes, average annual State Water Project (SWP) deliveries are likely to decrease in average years, and the driest years may result in no deliveries
Longer, more severe, and more frequent droughts may result in decreased surface water supply availability
Longer, more severe, and more frequent droughts and increased evapotranspiration may result in increased outdoor demands
Groundwater recharge is expected to decrease in some basins
Specific to water treatment plants, some of the top climate-driven risks identified in the Water Supply Reliability Assessment include impacts on water quality and key staff. Drought, extreme precipitation, high temperatures, and forest fires can contribute to influxes of nutrients in water sources and cause cyanobacterial blooms, which may produce contaminants that must be treated. Wildfires and other climate-related risks may also prevent staff from accessing water facilities and conducting vital operations. A selection of the highest and more moderate risk facilities is expected to be the focus of risk reduction efforts moving forward.
We have also identified a series of transition- and climate-related risks that may influence our evolving climate strategy. These risks include changes in the market and in consumer demands, due to differences in generational behaviors, shifts in population locations based on climate changes, and variations in water needs. Regulatory risks, such as emission trading systems and carbon taxes, could also financially impact our business. Federal and state regulations may further establish requirements for managing water supplies and limiting impacts on local wildlife, while regional plans and legislation could directly affect how we address water issues. As climate-related impacts continue to affect our industry, we intend to assess transition risks to our business more thoroughly and proactively incorporate these considerations into planning and decision-making processes.
We regularly refresh our Enterprise Risk Management program to analyze risks, revise mitigation controls, and update risk summaries. In 2022, we incorporated findings from our climate change studies to enhance our Enterprise Risk Management model. Risk area owners reviewed opportunities to integrate these updated climate-related risks into our existing risk planning.
Managing Risks and Developing Strategies
Managing the impacts of climate-related risks requires climate mitigation and adaptation throughout our business, including sourcing, treatment and distribution, and community engagement. We aim to minimize our own carbon footprint by increasing the efficiency of our fleet, reducing energy requirements throughout our water systems and distribution infrastructure, and transitioning to renewable sources of energy, where possible. We also communicate with our customers to encourage conservation that may lead to associated energy savings.
For more information about our approach to addressing our emissions footprint, see the Energy and Emissions section.
In order to better adapt to the increasingly prevalent effects of climate change identified in our various climate risk assessments, we leverage adaptive planning pathways. Through these pathways, we seek to develop implementation horizons and triggers while maintaining the greatest flexibility to respond to changing climate, financial, and regulatory circumstances. Our adaptation planning framework includes:
Prioritizing top risks
Evaluating the applicability of climate adaptation strategies to various climate scenarios and seeking to prepare for the worst-case scenario, where possible
Undertaking viability assessments of proposed risk reduction opportunities
Coordinating recommended actions with other planned capital or maintenance work at targeted facilities
Developing project implementation plans in the short-, mid-, and long-term timeframes
We continue to invest in the resilience of our infrastructure, seek to predict and prepare for changes in service demands, and practice water stewardship and conservation. We regularly monitor and diversify water supplies to support reliability, and we contribute to ongoing research. To learn more about how we promote water supply reliability, see the Water Supply Management, Reliability, and Resilience section. We also strive to adapt to climate change and preserve water availability by saving water in our distribution system and engaging our communities to minimize downstream consumption. For additional information about our efforts, see the Water System Efficiency section and the End-Use Conservation section.
We continue to monitor and maintain the quality of our water, which we have identified as a key climate-related risk area. The Drinking Water Quality and Customer Safety section describes our water quality program. Additionally, we aim to strategically balance our investments to adapt to climate change and protect the human right to access safe and affordable water by advocating for financial support for our customers in need. For more information, see the Water Affordability and Access section.
Measuring Progress and Setting Objectives
We believe that data drives meaningful action. Identifying climate-related risks has emphasized the importance of measuring our performance so we can, in turn, monitor our ability to mitigate and adapt to climate change. Measuring our energy consumption and greenhouse gas emissions data helps Group assess our contributions to climate change and manage our environmental impacts across our operations. In 2022, we worked with an independent third-party to complete an updated inventory of our greenhouse gas emissions in accordance with the Greenhouse Gas Protocol, the global standard for measuring and managing organizational greenhouse gas emissions. This continued progress in developing a more thorough and complete picture of our emissions is a critical step in establishing a baseline from which we can set meaningful reduction targets. Additionally, we track metrics related to water supply, system efficiency, conservation, water quality, emergency preparation and response, and other areas where the impacts of climate change on our business are most prevalent.
We have publicly committed to a number of objectives related to reducing our emissions footprint and promoting resilience against climate-related risks. These objectives include:
2023
By 2023, develop and begin implementing an enterprise-wide, renewable power purchasing strategy to increase renewable electricity use and decrease Scope 2 greenhouse gas emissions.
2024
Set absolute, science-based greenhouse gas emissions reduction targets for Scope 1 and Scope 2 emissions by the end of the third quarter of 2024.
2025
By 2025, complete comprehensive data analysis and modelling, and establish and publish targets for energy/greenhouse gas intensity of water sourced and/or delivered to customers.
2027
Meet the water-use targets mandated by the State of California for each district effective in 2027.
2032
In the next 10 years, invest no less than $5 million in emissions-reducing energy solutions, such as renewables and low-carbon energy sources.
2035
Develop a company-wide electric vehicle strategy, including a plan to purchase 100% zero-emission passenger vehicles in California by 2035.
2035
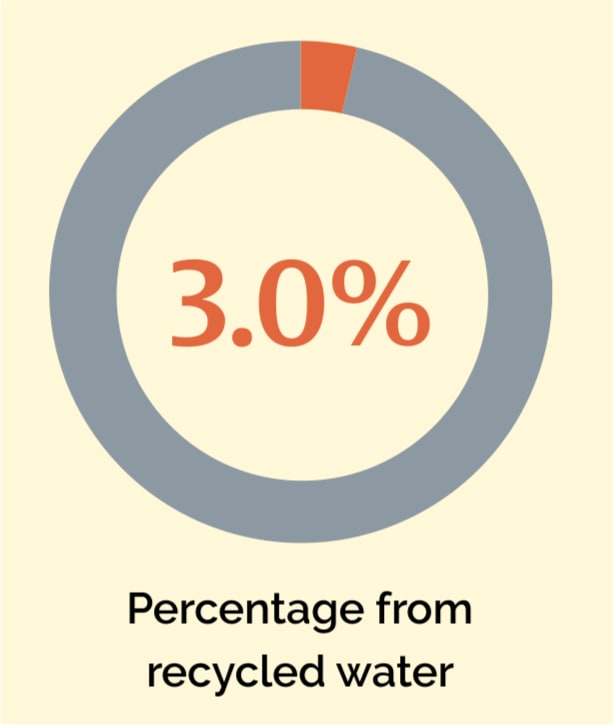
By 2035, increase the use of recycled water in our operations to no less than 5% of total water supply to customers.
For more information on these objectives and progress against these goals in 2022, see the Our Objectives section.
Maintaining Accountability
We manage climate-related risks and opportunities through multiple levels at Group by employing the following structures of oversight and management:
Board level: Our Board of Directors periodically reviews and discusses our climate-related risks and opportunities and maintains responsibility for formal approval and oversight of our climate change strategy. Executive leadership regularly reports to the Board on ESG and climate change progress throughout the year. Various departments also provide regular updates to the Board on routine operational priorities relating to climate mitigation and adaptation efforts. Given the importance of climate-related impacts to our business and their interrelation to numerous other ESG focus areas at Group, the Board considers climate-related issues while guiding business strategy, developing action plans, setting objectives, and evaluating company expenditures. The Nominating/Corporate Governance Committee maintains oversight of ESG programs and disclosures, including those related specifically to climate change.
Executive level: Our executive leadership team, led by the CEO, collaboratively develop, manage, and execute on our climate change strategy. This is primarily accomplished through the Strategy & Operating Committee and ESG Executive Oversight Committee. Our Vice President (VP), Customer Service & Chief Citizenship Officer and Chief Water Resource Sustainability Officer drive our climate-related efforts. Executive-level updates and discussions frequently cover climate-related issues, such as wildfire preparation, water supply planning, and drought response. Our VP, Information Technology & Chief Risk Officer, also leads our Enterprise Risk Management team to factor climate change into our risk analysis and framework.
Additional oversight and management: Various teams monitor material climate-related issues and collaborate throughout Group to manage these impacts:
The Water Resource Sustainability Department, directed by the Chief Water Resource Sustainability Officer, leads our overarching climate change strategy, with a focus on risk assessment and adaptation strategies relating to water resource sustainability.
Although our climate change strategy requires inputs from across all departments at Group, our Fleet and Facilities, Operations, Engineering, Rates, and Water Quality teams collaborate closely with the Water Resource Sustainability Department, ESG team, and executive leadership on climate change mitigation and adaptation efforts.
We also have multiple, cross-functional ESG Working Groups that focus on the three elements of our climate change strategy: mitigation, adaptation, and reporting and compliance. These cross-departmental working groups include officer sponsors as well as directors, managers, and other subject matter experts from teams with relevant skill sets or areas of responsibility across the Company. The ESG Executive Oversight Committee receives updates on the ESG Working Groups during their quarterly meetings.
For information on ESG governance at Group, see the Corporate Governance section.
Reducing energy demand and emissions within our operations is a key part of our strategy for mitigating our contribution to climate change. We are focused on increasing our operational efficiency, leveraging renewable energy sources, promoting fleet sustainability, and enhancing data management processes that may provide additional insights.
Operational Efficiency
While our work to minimize energy consumption spans our subsidiary operations, we have focused our more ambitious efforts in California, where greater than 90% of our operations are located.
Leadership in Energy and Environmental Design (LEED) standards guide construction of new and updated employee occupied buildings at Group. To help enhance energy efficiency in existing office buildings, we seek to optimize heating, ventilation, and air conditioning (HVAC) systems, upgrade to LED lighting, and replace copiers and printers with more energy-efficient models at the end of their useful life.
We also regularly conduct performance assessments of pumping equipment to evaluate opportunities for increasing our use of higher-efficiency pumps and motors and replacing inefficient assets as needed. Although we maintain fossil fuel-powered backup generators for pump stations and other facilities required for business continuity during power outages, these generators are not a significant part of our footprint. For information about our energy and emissions data, see the 2022 Highlights section and the 2022 ESG Analyst Download.
Throughout our supply and distribution systems, we utilize demand response systems to reduce our energy use during peak demand times. This is intended to reduce strain on the electrical grid, while also providing associated financial benefits. For example, our Bakersfield peak demand reduction program shuts down wells during emergency electric power shortage events and offer rebates to participating customers. In Hawaii, our “Rider-M” program generates a discount on energy bills by pausing operation of wells during certain times of the day.
To help conserve water and reduce the energy demands required to process and distribute water in our system, we proactively monitor, maintain, and replace pipelines and infrastructure. For additional information about how water efficiency complements energy efficiency, see the Water System Efficiency section. We also encourage our customers to reduce their water consumption, which lowers energy use and reduces our Scope 3 emissions. See our End-Use Conservation section for more information about our engagement with customers about conservation.
Renewable Energy
We continue to invest in renewable energy sources as a way to reduce reliance on fossil fuels and support our transition to a low-carbon economy. To date, we have invested approximately $3 million in renewable power generation infrastructure at our facilities. Our on-site renewable energy portfolio includes solar panels at our Chico District Customer Center, an inline hydro turbine system in our Rancho Dominguez District, and a wind turbine and inline hydro turbine system in our Waikoloa District in Hawaii. Where feasible, we enroll in programs with our electric utility providers that give us the opportunity to purchase more of our energy from renewable sources. In some California service areas, we also purchase electricity from Community Choice Aggregators who sell power with higher renewable energy percentages than other providers.
Fleet Sustainability
Our diesel- and gasoline-powered vehicles represent the majority of fossil fuel assets that we own and regularly operate. We seek to strategically address these investments in fossil fuels by focusing on enhancing our fleet’s sustainability. The degree to which we do this depends on state-specific needs and feasibility:
Efficient vehicles: We have standardized our vehicle selection approach to replace older vehicles with more fuel-efficient ones. In alignment with California Air Resources Board (CARB) regulations, we replace aging diesel trucks with lower-emitting alternatives.
Fleet electrification: We also procure hybrid and electric vehicles, where possible. We are developing a fleet electrification strategy, currently focused on California, to phase out the purchase of fossil-fuel passenger vehicles. This is in alignment with CARB regulations, which mandate that zero-emissions vehicles must represent 100% of new passenger vehicles sales by 2035. To support the electrification of our fleet, our San Jose and Bayshore District facilities also provide electric vehicle (EV) charging stations, and we continue to evaluate and build additional EV charging stations in California. For information about current progress on our fleet strategy, see the 2022 Highlights section.
Route optimization: Our online platform automates our processes to schedule maintenance, communicate with customers, and optimize routes to job sites. This automation also reduces paper documentation and fuel consumption.
Travel reduction: Video conferencing allows us to limit employee business travel, minimizing emissions and the costs associated with operating vehicles. We continue to evaluate opportunities to further reduce travel, where possible.
Commuter benefits: In California, our commuter benefits program encourages employees to reduce their personal vehicle emissions by utilizing public transportation and ridesharing.
Throughout our operations, we implemented projects designed to improve energy efficiency and management:
Energy management system: We continued to make progress on the development of an Energy Management System (EnMS) that would support a more detailed measurement and assessment of our energy consumption and costs in California. This EnMS is intended to allow us to evaluate energy usage and efficiency data at the asset level to help identify energy optimization strategies and define energy-related policies and objectives.
Backup energy sources: In September 2022, during Energy Emergency Alerts, we made adjustments to our operations and used backup generators to alleviate power demands on the statewide California power grid, doing our part to prevent rotating power outages to customers.
Asset replacement program: We performed 995 efficiency tests on 785 pumps and completed 61 water pump or motor replacement or rebuild projects to increase efficiency in our water distribution systems.
LED lighting: We completed LED lighting retrofits for our CSS campus and water quality laboratory in 2022, which are estimated to result in savings of more than $19,000 per year.
HVAC systems: We continue to pursue opportunities for HVAC optimization at our Customer Support Services (CSS) headquarters. Once these improvements have been completed, they are projected to support energy savings amounting to more than approximately $100,000 per year.
Renewable Energy
Aligned with our ambition to increase renewable electricity use, we are leveraging findings from market research and electrical demand analyses to develop an evidence-based renewable power purchasing strategy. We also commenced operation of an inline hydroturbine in our Waikoloa, Hawaii service area in March 2022. By capturing the energy generated from flowing water, the hydroturbine can produce up to 100 kilowatts of electrical power. Hawaii Water sells the electricity generated by the turbine to the local energy utility. In addition to supplying renewable energy to the grid, these efforts have enabled cost savings that can be passed on to our customers. Over the course of nine months of operation in 2022, the hydroturbine produced approximately 418,000 kilowatt-hours of energy and generated an income of over $100,000 for Hawaii Water. For more information, please see our Hawaii Water Services web site.
Fleet Sustainability
We completed a study to better understand optimal vehicle replacement cycles and inform our roadmap for electrification. The study focused on evaluating current fleet replacement policies and opportunities to downsize vehicles based on job functions; to reduce safety accidents; and to further electrify our fleet over time in California. The results have informed our policies and standards for vehicle purchase, use, and maintenance. We intend to continue to use the findings of this study to further evaluate the availability of EVs in the market and the opportunity to integrate EVs into our fleet operations.
Energy and Emissions Metrics
In 2022 we worked with a third party to update our Scope 1, Scope 2, and partial Scope 3 greenhouse gas (GHG) emissions inventory, starting with 2021 data. The inventory aligns with the Greenhouse Gas Protocol: A Corporate Accounting and Reporting Standard (Revised Edition), GHG Protocol Scope 2 Guidance, and Corporate Value Chain (Scope 3) Accounting and Reporting Standard, collectively referred to as the “GHG Protocol,” and represents considerable progress in our journey to further improve the breadth and integrity of our energy and emissions data. This updated inventory allows us to use actionable data to inform implementation of our climate strategy, and to be methodical and thoughtful in establishing a baseline for emissions reduction target-setting efforts, including our commitment to develop a GHG intensity target by 2025 and to set absolute, science-based GHG emissions reduction targets for Scope 1 and Scope 2 emissions by the end of the third quarter of 2024. Additionally, this data collection is intended to help prepare Group for emerging regulations and disclosure standards. In the coming years, we plan to build upon this progress and to continue to work to expand and improve our emissions data collection, management, and calculation methodologies across our value chain for future GHG emission disclosures.
Although we are committed to setting emissions reduction targets to minimize our carbon footprint, our ability to make investments to reduce our emissions and increase our use of renewable energy sources is limited because such investments must be supported by our regulators, the state public utilities commissions. As we continue to mature our climate change strategy, we intend to focus on what we can control and to advocate for meaningful progress from our regulators.
See the 2022 ESG Analyst Download for additional details on our energy and emissions metrics, including three-year trended data, calculation methodologies, and more.
9.3%
renewable energy consumption4
0.21
GHG emissions intensity of water produced (metric tons CO2e / AF)5
minus-8.18%
change in total (Scope 1, 2, and 3) GHG emissions from previous year (2021)6
4 In alignment with the SASB Water Utilities and Services Industry Standard, this metric is calculated by dividing our renewable energy consumption by our total energy consumption and reflects renewable energy calculation methodologies in accordance with the market-based Scope 2 methodology from the GHG Protocol. The percentage only includes renewable energy from electric utility green tariffs and Cal Water’s owned on-site solar system in Chico, California, for which Cal Water retains the renewable energy credits. Other renewable energy generation or purchases, such as the energy from the hydroturbines in California and Hawaii, the wind turbine in Hawaii, and electricity purchased from Community Choice Aggregators with higher percentages of renewable power, are not considered renewable consumption by Group because renewable energy credits are either not generated or not retained by Group.
5 CO2e = carbon dioxide equivalent. AF = acre-foot. This metric is calculated by dividing total GHG emissions by volume of water produced. The numerator includes certain Scope 1, market-based Scope 2, and Scope 3 emissions from activities that contribute to the sourcing, treatment, and delivery of water to customers. It excludes emissions associated with the Scope 3 Categories 1 (Purchased Goods and Services) and 2 (Capital Goods), as well as emissions associated with office sites, fleet fuels, and other non-water production-related activities. The denominator includes the total volume of water produced by Group, including purchased water, groundwater, surface water, and recycled water.
6 Data includes percent change in total GHG emissions from 2021 compared to 2022, where Scope 2 emissions are market-based.
■ Scope 3 (Purchased Goods and Services, Capital Goods, and Waste Generated in Operations)9
7 Scope 1 emissions refers to direct GHG emissions from sources owned or controlled by Group. The primary emissions sources reflected in our Scope 1 emissions include natural gas, stationary and mobile fuel combustion sources, and process emissions from wastewater treatment of organic and nitrogen content.
8 Scope 2 emissions refers to indirect GHG emissions from the generation of purchased electricity that is consumed in Group’s owned or controlled equipment or operations. The primary sources of our Scope 2 emissions include purchased electricity and renewable energy. We have calculated Scope 2 emissions for 2021 and 2022 with both market-based and location-based methodologies in alignment with the GHG Protocol Scope 2 Guidance’s “dual reporting” requirement. For location-based Scope 2 emissions, see the 2022 ESG Analyst Download.
9 Scope 3 emissions refers to other indirect GHG emissions resulting from Group’s value chain activities. We reviewed all fifteen Scope 3 categories of the GHG Protocol when assessing the categories to focus on for our 2021 and 2022 emissions inventory. We chose the three Scope 3 categories we believe to be the most significant, most relevant to our business, and/or most impactful for addressing our overall emissions footprint based on the nature of our business: Categories 1 (Purchased Goods and Services), 2 (Capital Goods), and 5 (Waste Generated in Operations). Group may have additional, relevant Scope 3 emissions sources; however, these have not been fully evaluated or calculated. Material data exceptions include the following: Category 5 (Waste Generated in Operations) emissions estimates include only those associated with the disposal, hauling, and treatment of waste streams from Group’s owned wastewater treatment plants and from wastewater generated by our customers and treated by third parties. Further sources of waste exist but were not calculated due to data unavailability. We continue to work to expand and improve our data collection for future GHG emissions disclosures.
2022 Energy Consumption (GJ)10
10 GJ = gigajoule. Total energy consumption reflects the total amount of energy directly consumed by Group during the reporting period, in alignment with the Sustainability Accounting Standards Board (SASB) Water Utilities and Services Industry Standard. The data includes energy purchased from sources external to Group (e.g., direct natural gas and fuel usage or purchased electricity) and self-generated energy (e.g., renewable power sources).
Water Supply Management, Reliability, and Resilience
We are committed to delivering safe, high-quality water to our communities. For this reason, we are focused on both supply reliability and the operational reliability of our water infrastructure and distribution network.
Supply Reliability
Our greatest water consumption activities are those associated with sourcing and delivering water to our customers. We strive to deliver a reliable supply of water to customers while reducing water loss throughout our entire operation. Group considers all of our water sources as freshwater, excluding recycled water, and supports freshwater availability by monitoring water withdrawal on a daily basis and regularly evaluating our sources of supply.
Our forward-looking approach to water supply management requires an understanding of the risks associated with our portfolio. Our climate change study highlighted potential vulnerabilities, such as increases in droughts and wildfires, declines in snowpack storage and natural groundwater recharge, and other risks that could impact water availability. In addition to this study, we determined risk ratings for specific surface water sources based on threat likelihood, consequence magnitude, and vulnerability. This assessment continues to inform our efforts to address climate-related risks to water quality and supply.
In California, we develop Water Supply and Demand Assessments, Urban Water Management Plans (UWMPs), Water Shortage Contingency Plans (WSCPs), and Water Supply Reliability Plans to support long-term water resource planning. These plans summarize and evaluate sources of supply, efficient uses, and demand management. They also inform our water management processes to forecast demand over time and enhance the reliability of water supplies. As we map and account for water risks, we also factor water stress into our ongoing supply evaluation and approach. For more information about our water resource plans, see the Planning for a Sustainable Future table.
Many of our water conservation efforts are focused on reducing customer consumption.
We engage regulatory agencies and address legislative requirements with a view to promote water supply reliability. Set in 2014, California’s Sustainable Groundwater Management Act (SGMA) required most water basins to establish a local groundwater sustainability agency (GSA) by 2017, develop a Groundwater Sustainability Plan (GSP) by 2022, and demonstrate progress to protect groundwater resources by 2027. When full SGMA implementation is achieved by 2040, we expect to source nearly all our California groundwater from sustainably managed basins.
The following programs reflect the many ways we manage supply reliability:
Responsible groundwater extraction: To help preserve the integrity of our water sources, we monitor groundwater levels and avoid sourcing from basins with limited supply, where possible. We also support groundwater recharge by paying well pump taxes that contribute to recharge facilities. Finally, we use surface water supplies in some districts to reduce our groundwater pumping and allow for aquifer recovery.
Preparing for new water sources: We proactively research, design, and permit new water sources, and seek to comply with regulations set to protect groundwater basins.
Collaboration with local authorities: We participate in GSAs in our service areas to manage regional groundwater levels, storage availability, seawater intrusion, water quality degradation, and land subsidence. We also contribute to boards and committees of GSAs and review potential projects to enhance local planning efforts.
Partnership with the Public Policy Institute of California (PPIC): In support of PPIC research, we provide funding and review and supply data for projects that evaluate groundwater management, climate-related impacts on wastewater and recycled water, and drought resilience.
Water conservation: To support long-term availability, we encourage reductions in customer water consumption. See the End-Use Conservation section for more information about these initiatives.
We continue to invest in recycled water sources and production to reduce dependence on freshwater sources and increase water supply resilience. Ongoing projects include:
Multiple wastewater treatment plants in Hawaii that provide recycled water for landscape irrigation and green spaces.
The Tesoro Viejo Wastewater Treatment and Recycled Water Production Plant, which Cal Water operates and maintains for the Tesoro Viejo Master Mutual Water Company (Tesoro Viejo). The treatment plant generates non-potable recycled water for Tesoro Viejo’s customer and community needs, such as landscape and agricultural irrigation and construction dust control.
Collaboration with the SF Peninsula Regional Pure Water Project (previously the Potable Reuse Exploratory Plan), which aims to explore indirect and direct potable reuse options in the Bay Area and to support the development of standardized water recycling criteria for direct potable reuse.
Recycled water service provided by Cal Water to the Apple Campus site located in the City of Cupertino. This recycled water, which comes from the City of Sunnyvale through Valley Water’s transmission facilities to the Apple Campus, supports landscaping, internal plumbing, and cooling at Apple Park.
Continued evaluation of additional recycled water opportunities in the Bay Area, King City, and other areas we serve that would increase availability of recycled water for customers.
Operational Reliability
We continually invest in our infrastructure to promote service reliability. In addition to routine maintenance, we upgrade our systems to improve resilience against climate-related risks. Sea level rise, floods, wildfires, and other threats may disrupt access to electricity and impact our ability to deliver water. Therefore, we invest in emergency generators, power transfer switches, fire hydrants, and new water lines to support water flow during fire events and control water pressures across distribution zones.
Our Water Supply and Facilities Master Plans support improvements for operational reliability. They guide long-term infrastructure investments and forecast future needs for each California district over 30-year timelines. For more information about our plans to manage our water systems, see the Planning for a Sustainable Future table.
Responding to Drought
Our Drought Response Program and WSCPs outline our procedures for mitigating water supply constraints during droughts and supplement our ongoing strategy to monitor and enhance long-term supply reliability. In preparation for extended drought conditions, we pursue capital projects such as increasing our filtering capacity and addressing changing water source quality and quantity. We seek to update critical equipment by replacing treatment filters and pumps in advance of droughts. We also identify and make improvements to bring existing wells back online and provide additional sources of water supply.
In California, our policy is to follow a set of drought severity stages to determine appropriate reductions in water use and support drought management. During these intense droughts, our WSCPs outline measures for increasing conservation and preserving our water sources. For more information about our efforts to promote conservation during droughts, see the End-Use Conservation section.
Approved in 2022, our Development Offset Program reflects our strategy to meet the needs of existing and new customers, while accommodating new projects that support a reliable supply of safe, clean, and affordable water. We established this program to account for projected delivery shortfalls during dry years and support continued water availability. The program establishes a fee for developers if a new development produces a net increase in water demand of 50 acre-feet or more. These funds are used to directly support investments for accelerating water supply projects and expanding conservation programs to offset the proposed development’s net demand increase.
WATER SUPPLY MANAGEMENT, RELIABILITY, AND RESILIENCE
2022 Highlights
In 2022, we made progress on the following projects to enhance our water supply management:
We completed the development of a Strategic Asset Management Plan (SAMP) for Cal Water. The SAMP provides a centralized framework for our asset management planning process. Based on an evaluation of a variety of factors—including the likelihood and consequence of asset failures—we use the SAMP to develop sustainable capital programs that help minimize risk and improve water system reliability while managing the financial impact on our customers.
Using scenario planning and an adaptive management planning strategy, we completed two Water Supply Reliability Studies that cover six districts. We have also initiated three new studies that cover 11 additional districts.
We continued progress on a multi-year program of capital projects across California to better prepare us to maintain a reliable supply of water during power interruptions and wildfire events. We completed 18 additional projects in 2022.
In partnership with the West Basin Municipal Water District (West Basin) and the Palos Verdes Estates Golf Course (PVEGC), we finalized an agreement to support a project that is intended to extend West Basin’s recycled water system and provide about 220 acre-feet of recycled water per year to the PVEGC.
To expand our wastewater treatment operations and increase recycled water generation, we began and/or completed acquisitions of three wastewater utilities in Hawaii, including Kukui’ula South Shore Community Services, HOH Utilities, LLC, and Keauhou Community Services, Inc.
We continued progress on a multiyear program of capital projects across California to better prepare us to maintain a reliable supply of water during power interruptions and wildfire events.
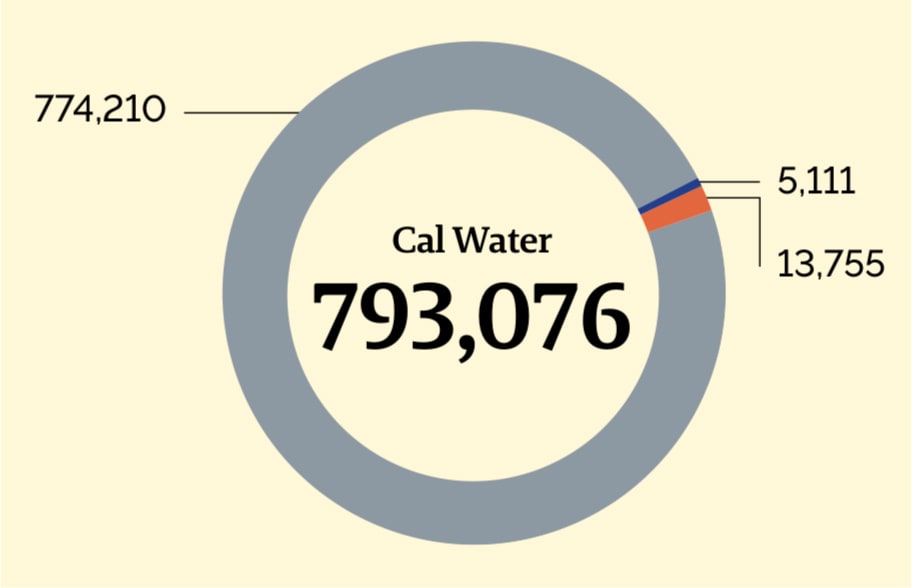
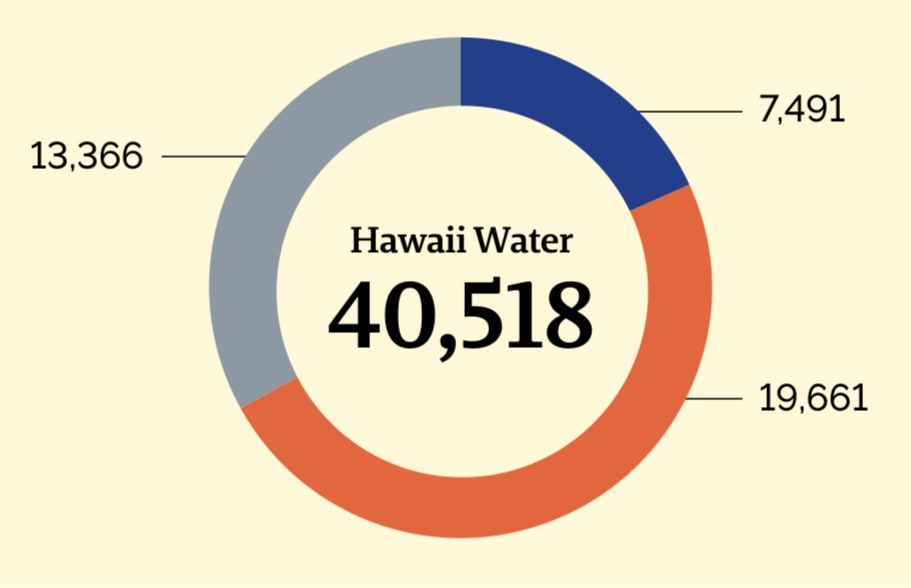
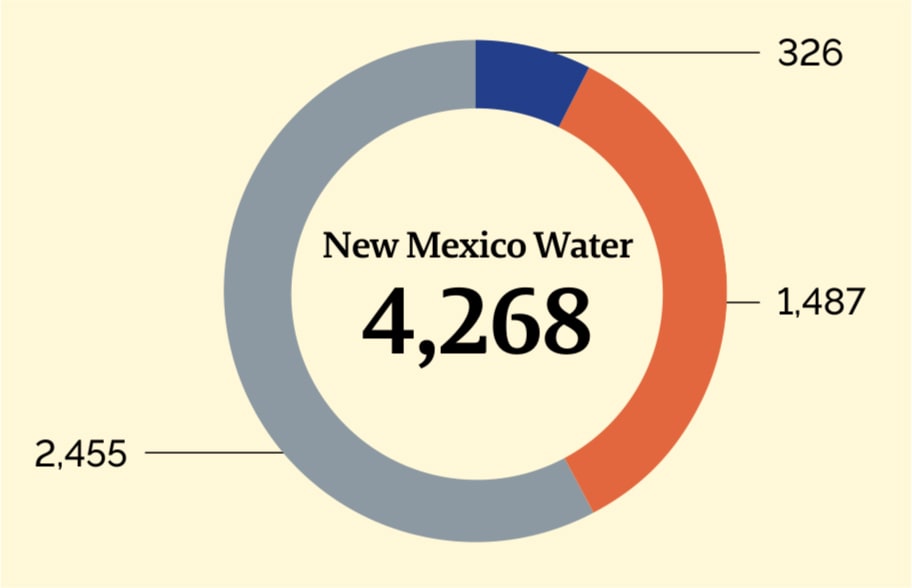
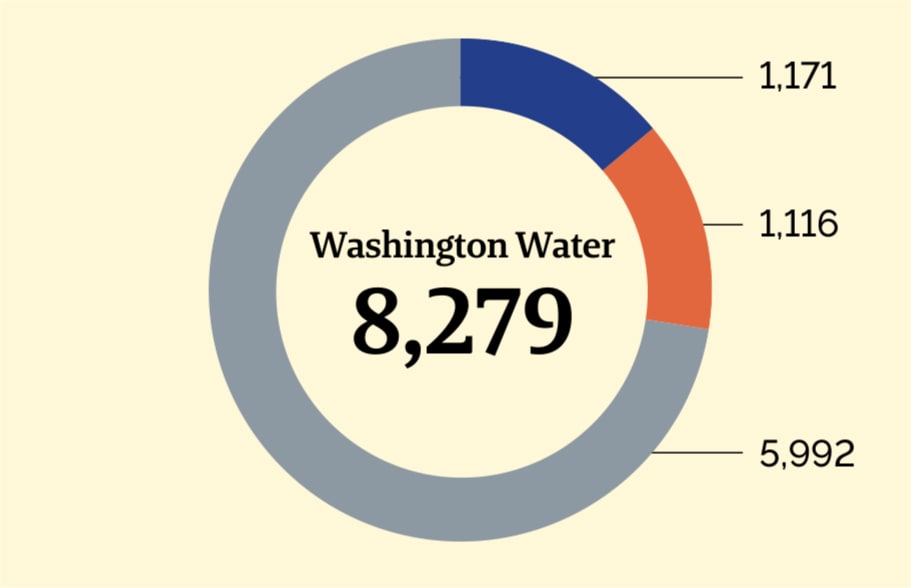
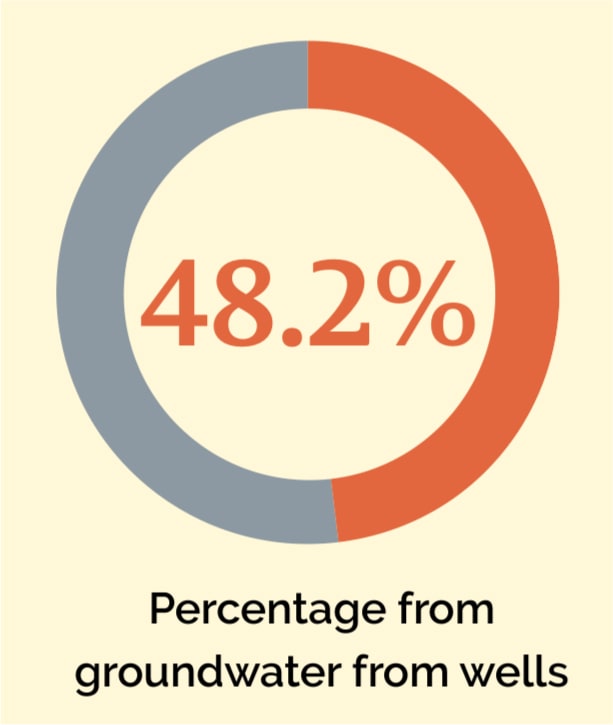
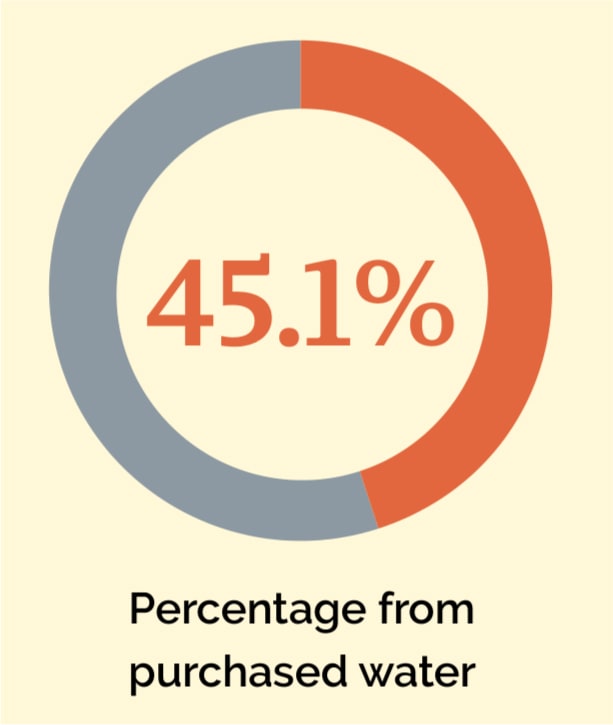
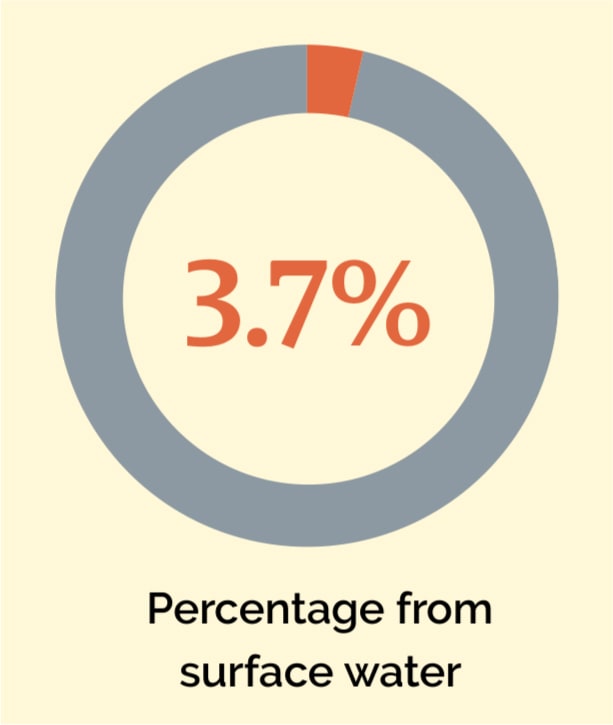
Water Source Mix for 2022
404,833
Total water sourced (thousand m3)
Recycled Water Delivered to Customers
2022
Total volume of recycled water delivered to customers (thousand m3)
Cal Water
8,066
Hawaii Water
1,333
New Mexico Water11
0
Washington Water
0
Total
9,399
11 We do not sell recycled water to customers in New Mexico at this time. As part of our discharge plan, we donate produced recycled water to a local homeowner’s association for landscaping purposes.
We continue to invest in recycled water sources and production to reduce dependence on freshwater sources and increase water supply resilience.
Water System Efficiency
By maintaining the efficiency and integrity of our water system, our goal is to reduce water loss and decrease energy demand. This, in turn, can lower customer costs and minimize unnecessary discharges to the environment.
Managing Water Loss
We maintain and tailor water loss control programs in each of our states designed to address district-specific needs and regulatory requirements. In states where we must report water losses or meet water loss reduction targets, we develop mitigation plans for systems that exceed water loss limits. To proactively drive our management approach, we track and seek to adhere to regulatory water loss standards and develop internal water loss limits where none exist. In California, we are working to meet the water loss reduction targets prescribed by the California State Water Resources Control Board, which is expected to enforce its regulations starting in 2028.
Group initiatives to target water losses include the following:
We proactively assess and repair leaks in a timely manner to minimize water loss.
Data analytics and visualization: We use a centralized reporting tool to track water loss to support the reporting of production volumes in a consistent, timely manner in our districts in all regions. Data on supply, demand, and non-revenue water is intended to support our teams to monitor and report on losses in alignment with regulations. We leverage the AWWA Free Water Audit Software in California and Hawaii to support our validation of our water loss limits, and we are evaluating opportunities to use this tool in additional states. We also incorporate data visualization tools to help inform our reporting. Through GIS-based spatial leak dashboards, we monitor leak types, current leaks being repaired, leaks by pipe material, and district-level trends. Our tools are designed to enable quarterly pulse checks to identify and manage errors, anomalies, and key events.
Meter calibration and testing: Our asset management reliability program includes regular production meter calibrations for wells, treatment plants, and interconnections. We also perform customer meter accuracy testing—and generally conduct testing more frequently for meters that process greater quantities of water. Additionally, we track calibration and meter testing reports for meters owned by our wholesale water providers and neighboring entities.
Meter replacements: Our customer meter replacement program includes meter replacements at specific intervals for our small- and medium-service size customers to further support data validity. Replacement intervals are intended to comply with industry best practices and standards dictated by the California Public Utilities Commission.
Leak repairs: We seek to assess, prioritize, repair, and document leaks in accordance with regulatory standards. Our process aims to safely handle infrastructure to minimize water service interruptions and water losses. We also track our leak repair times in an effort to accurately estimate water loss volumes.
Infrastructure upgrades: Throughout our locations, we seek to evaluate pipelines for risks related to age, material, leaks, and leak location. Based on our analyses, we prioritize certain pipelines for replacement and integrate the data into our GIS mapping tools to visualize the location and replacement timeline. These efforts can lead to significant impacts and direct reductions in water losses. In California, we incorporate replacement recommendations into our General Rate Case Main Replacement Program, and our associated steering committee guides our formal strategy for replacements.
Water Loss Auditing and Control (WLAC) program: In California, the WLAC program is designed to establish and document water loss auditing and control standards to support compliance with current and future statewide water loss regulations while enhancing our field practices, data management, affordability, distribution efficiency, and accuracy of revenue generation. Our initial Water Loss Control Steering Committee evolved into our current WLAC program team, which includes representatives from a variety of departments and promotes crossfunctional collaboration.
External engagement: We participated in the development of performance standards for water loss control by the California State Water Resources Control Board. In Washington, we also engage with the public by hosting annual forums about our water-use efficiency efforts.
In 2022, we supported water system efficiency through the following initiatives:
Infrastructure investments: Across Group, we invested $327.8 million in capital expenditures, both Company-funded and developer-funded. Some of the largest water system infrastructure projects funded by these investments included replacing 25 miles of water pipeline through our main replacement program; additional water pipeline projects to improve water distribution system resiliency; replacements of pumps and motors, flowmeters, and control valves; projects to replace, upgrade, and retrofit water storage tanks and pressure vessels; and projects to strengthen our ability to maintain service in the event of wildfire and public safety power shutoffs. These and all of the other capital investments we make each year help to enhance system efficiency and resiliency, and protect against climate-related risks, such as floods, storms, and wildfires.
Pilot projects: In select districts, we implemented pilot projects to evaluate technologies that proactively detect unsurfaced leaks and determine the most effective options to address them. Through these projects, we assess manual acoustic surveys, acoustic sensors, satellite leak detection, and district metering that targets zones with higher water loss. We are also piloting a mobile tool in certain systems to enable electronic reporting of leak repairs, which improves convenience, documentation efficiency, and data availability.
Water loss standards: Aiming to extend our commitment beyond baseline compliance, we initiated a multi-year plan to develop our own industry-consistent water loss limits for service areas without existing regulatory standards.
Infrastructure Management12
Category
2020
2021
2022
Volume of non-revenue real water losses (thousand m³)13
15,379
13,611
14,907
Water main replacement rate
0.66%
0.45%
0.43%
12 Data listed herein for annual non-revenue real water losses and water main replacement rate represent the Cal Water subsidiary only. Non-revenue real water losses refer to the total volume of physical water leakages, which are not billed and produce no revenue, occurring in the distribution system through breaks, spills, or other means in the given year. The water main replacement rate refers to the total length of pipe replaced during the reporting year, as a percentage of the total length of existing water mains in Cal Water’s distribution systems for the given year.
13 Calculated using American Water Works Association Free Water Audit Software (v6.0) methodology. Validated water loss audits are completed after the publishing of this report; therefore, volumes listed herein are subject to change as a result of state-regulated validation processes and requirements.
25
Miles of main replaced in 2022
End-Use Conservation
Conservation is key. To help increase water supply reliability in the face of more frequent droughts, we maintain plans designed to combat water shortages and offer programs that are intended to engage and encourage customers to conserve water.
Responsible Conservation
Our Conservation Master Plans direct our ongoing approach to the promotion of efficient water consumption. Produced on a five-year cycle, these plans analyze our water conservation programs and the associated costs of implementation. For more information about our management plans, see the Planning for a Sustainable Future table.
Led by our Drought Steering Committee, our Drought Response Program further guides our conservation efforts to specifically address drought in California. To support our efforts to maintain safe, clean, and reliable water for our residential and business customers, Cal Water follows a set of drought severity stages to determine the level of water conservation needed and assess potential water-use restrictions. We call on our customers to follow actions based on current drought conditions, outlined on our Drought web site. Policies focus on increasing rebates, restricting outdoor landscape irrigation, providing guidelines for commercial businesses, implementing penalties for excessive water use, and installing flow-restricting devices. We promote proactive communication with our customers to explain any changes in drought conditions and water conservation needs.
Even when not in times of drought, we continue to work to increase awareness of the benefits of conservation across our subsidiaries and implement programming in California to help meet regulatory water-use reduction targets set by state agencies.
Conservation is not only intended to help alleviate water supply constraints—in our experience, it also generally corresponds to greater affordability for our customers. To help illustrate this trend, we completed a study in 2021 across five districts in California, which represented different geographies and demographics. We believe the results demonstrated that lower per capita water demand reduced operating costs over time.
We offer multiple programs to encourage customer conservation, including:
Rebates for replacement of lawns with low-water-use landscaping; conversions from spray to drip irrigation systems; high-efficiency toilets, clothes washers, and sprinkler nozzles; and the installation of smart irrigation controllers
Our free Smart Landscape Tune-Up program—which focuses on low-income customers—evaluates customer irrigation systems, installs high-efficiency nozzles, provides weather-based irrigation controllers, and repairs leaks in irrigation systems
Customer conservation kits that offer efficient hose nozzles and showerheads, faucet aerators, and leak detection tablets
Opportunities to learn about conservation and efficiency through informational fact sheets, online resources, local water conservation reports, and our subsidiary web sites
Customized incentive programs for commercial customers
Multiple community engagement initiatives that promote conservation. These initiatives are described further in the Community Support section
We also engage in external partnerships as a way to contribute to a broader array of conservation initiatives. We are members of the Alliance for Water Efficiency, and one of our officers serves on the Board of Directors for the California Water Efficiency Partnership. Additionally, we collaborate with the American Water Works Association and are an Environmental Protection Agency (EPA) WaterSense Partner.
EMPOWERING CUSTOMERS WITH WATER MONITORING TECHNOLOGY
In 2022, we launched instant rebates for new Flume devices, which are self-installed water monitoring instruments that offer flow data, leak detection notifications, and insights into water usage for individual appliances. These devices are designed to easily connect to a phone application and empower our customers to understand trends in their water consumption. We provided discounts that significantly lowered costs for purchasing Flume devices and sought to support customers to leverage data, target improvements in water conservation, and achieve savings.
END-USE CONSERVATION
2022 Highlights
In 2022, we faced ongoing drought conditions in the state of California. As part of our Drought Response Plan and based on local supply conditions and regulatory requirements, districts throughout the state entered Stage 2 of our Water Shortage Contingency Plan. Please visit our Drought web site to learn more about the various stages of drought. Varying degrees of drought were also experienced in Hawaii, New Mexico, Texas, and Washington. Where needed, we provided information to customers through direct mail and additional outreach on the need to reduce water use.
We also continued to enhance our conservation programs in 2022 in the following ways:
We increased our media campaigns for conservation, continued our ongoing customer leaks campaign, and performed targeted outreach to engage high-use customers, low-income customers, and other key stakeholders.
Group increased the dollar amounts for rebates to Cal Water customers for EPA WaterSense-labeled products and our lawn-to-garden turf replacement rebate program.
We continued the development of customized water-use targets for individual customers and/or households to increase water efficiency and help meet regulatory water-use reduction targets. Customer water efficiency is based on a variety of factors, including household size, landscaping water needs, and local climate. We plan to roll out the individualized targets in the near future.
To help grow our conservation programs outside of California, we assessed water systems in Washington, Hawaii, and New Mexico to identify service areas with higher water rights or water supply risks that may serve as priority locations for targeted conservation programming. We then developed conservation branding and/or pilot-scale conservation programs for use in high-priority areas in each state. Moving forward, we intend to monitor the outcomes and success rates of these efforts. Results are expected to inform subsequent rate filings and introduce larger-scale conservation programs, where applicable, to support sustainable water supply, efficient water use, and affordability.
~180 million
gallons of water saved by our customers annually from water-saving efficiency measures implemented during 2022 across our 24 California districts
More than
$6.1 million
invested in water conservation rebates and programs for customers
Cal Water customers throughout the state reduced their water use from a 2020 baseline for 8 months in a row from May through December 2022. In December, company-wide water savings reached 16.5% compared to December 2020, surpassing the state’s conservation target of 15%.
Environmental Management and Compliance
We are committed to protecting the natural ecosystem by complying with state-specific regulations and mitigating potential impacts related to planned and unplanned potable water and wastewater discharges, chemical spills, waste disposal, and other risks.
Stewarding Our Natural Environment
As part of our environmental management program, we strive for zero instances of non-compliance with regulations. In the event of a violation, our expectation is the timely and accurate reporting of such events, consistent with regulatory requirements, followed by root cause analysis and the development and execution of revised operations and response plans to prevent a recurrence.
We also strive to mitigate our impacts on our natural environments by aligning with local regulations, such as the California Environmental Quality Act (CEQA). By designing projects that take local species into account, we believe we can minimize the effects from our construction and installation activities on biodiversity. Project planning and biological surveys help define a process for minimizing impacts on species and sensitive waterways and habitats. We seek to implement best management practices throughout our activities, including site restoration or mitigation to preserve healthy ecosystems.
Discharge Management and Spill Prevention
Our Environmental and Operations Departments work together to support our compliance with relevant permits and regulations that address effluent management, such as the National Pollutant Discharge Elimination System (NPDES). In California, employees receive a Discharge Management Guidance Manual and annual training on effluent, potable, and groundwater discharges. We also oversee proper chemical storage at our water treatment facilities intended to mitigate the risk of chemical spills. We also work to align with applicable regulations in other states. Seeking to proactively prepare for compliance with future mandates, we continue to monitor the regulatory landscape, maintain open dialogue with legislative bodies, and evaluate treatment technologies that can enhance our water effluent quality.
We also conduct audits to support compliance and manage risks. In preparation for emergencies, we outline procedures for responding to infrastructure failures or other events that may cause unregulated releases from potable water and wastewater utility systems. Such releases may contain chlorinated water or untreated wastewater that could harm aquatic species. We seek to proactively incorporate input from third-party biologists and mobilize field teams to neutralize the discharges before potentially impacting water sources and ecosystems.
We manage and treat wastewater to minimize its impact on water sources and ecosystems.
Wastewater Treatment
Although our wastewater services are far less extensive than our drinking water services, we maintain a team of over 50 certified wastewater treatment professionals to support effective collection and treatment of wastewater before discharging it to the environment or selling it to customers for reuse. It is Group policy to comply with all applicable regulations in each location and maintain the associated treatment facility discharge and recycled water permits for our wastewater treatment systems.
We regularly inspect, clean, and maintain our wastewater collection systems to help reduce the risk of blockages and sanitary sewer overflows. Our team completes video and/or visual evaluations of our systems and often uses Closed Circuit Television Video (CCTV) inspections to avoid more invasive methods. Inspection frequency may vary by type, but inspections typically are completed at a frequency intended to prevent sanitary sewer overflows. Depending on the system, our maintenance activities may include anything from cleaning systems with high-pressure equipment to removing solids or debris buildup. We also proactively engage our customers to help prevent sewer blockages by communicating how fats, oils, and grease can block collection systems and lead to sanitary sewer overflows. Additionally, we work to anticipate periods of increased demand and plan for expanded operation of wastewater systems, as needed.
We use various treatment methods across our wastewater treatment systems, primarily consisting of membrane bioreactors, moving bed bioreactors, and sequencing batch reactors, with minimal operations employing conventional activated sludge and facultative lagoon treatment methods.
To help manage residual biosolids, we utilize land application, composting, dewatering for offsite disposal by third parties, and in very few cases, sludge lagoons. Group continues to explore options for other alternative disposal methods for sewer sludge. Currently, we dispose of it in landfills when alternative methods are not either available or cost-effective.
At many of our treatment facilities, particularly those in Hawaii and California, wastewater is converted to nonpotable recycled water for reuse. For more information on our recycled water programs, see the Water Supply Management, Reliability, and Resilience section.
Waste Management
We promote efforts to reduce, reuse, and recycle various waste streams across our operations, while keeping affordability and feasibility top of mind:
Hazardous waste: Our environmental team oversees the handling of hazardous waste to support alignment with current regulations. In California, operations and laboratory employees also receive annual training for hazardous waste management. We continue to identify opportunities to minimize hazardous waste. Past efforts have included modifying our water treatment processes to reduce average hazardous chromium waste volumes by 70%. As part of our remediation activities, we have voluntarily removed residual mercury left from previous waste materials, and we often engage local agencies to provide voluntary oversight of waste cleanup during site remediation.
Production waste: We handle production waste based on the type of waste material and local waste diversion options. First, we prioritize reductions in waste generation, and then we pursue reuse and recycling, as needed. Our efforts include, but are not limited to, initiatives to minimize waste from demolitions and reuse materials from water storage tank cleanings during road construction.
Office waste: Depending on the services available at each of our locations, we use separate containers to recycle paper products and collect wet compost in our offices where possible. In San Jose, our campus also collects bottles and cans and donates them to a local church that recycles the materials to finance water well installations in developing countries. Additionally, we contract a third-party vendor to recycle batteries and light bulbs.
E-waste: In California, our Information Technology (IT) Department collaborates with a third party to recycle e-waste, including IT equipment and electronic components. Our team also leverages this partnership in other states and engages local e-waste companies, as needed.
To help safeguard our employees and minimize risks, we provide protective equipment, tools, and training for employees who may interact with potentially harmful waste streams. We also continue to pursue safer, alternative materials that offer lower toxicities, when possible.
Material Sourcing and Consumption
We support sustainable consumption by leveraging environmentally friendly materials and avoiding excessive purchasing where possible. In California office facilities, we source furniture and work surfaces that meet sustainability standards, such as qualifications from the Forest Stewardship Council, Intertek’s Clean Air certification, and the LEVEL standard for responsibly sourcing furniture. We apply our approach to sustainable procurement to all states, where possible, and continue to evaluate additional opportunities for reducing materials consumption.
LEED standards guide our design and construction activities for both existing buildings and new building projects. When we build new buildings or remodel a space, we also install drinking water refill stations to support reusable bottles. For other environmental initiatives in our offices and facilities, see the Energy and Emissions section.
Air Emissions
We manage air emissions beyond greenhouse gases to support our compliance with environmental standards and reduce air pollutants. We hold permits for backup generators, and we select generator technologies that are designed to meet requirements for emissions controls to address California legislation regarding air toxins. We also have permits for a few small wells in California to help manage hydrogen sulfide removal from the water. We do not meet the threshold to require federal air permits, which reflects our lower impact on air emissions overall.
In 2022, we piloted a data application in California to collect and manage data required for permits related to planned and unplanned discharges from our water systems. In addition to replacing a paper-based system, the technology improved process efficiency, data integrity, and data access in the field.
We also developed a relationship with a manufacturer who specializes in remanufactured office furniture to support a circular economy. We ordered recycled furniture for an office relocation in Washington and intend to continue to partner with this manufacturer where possible.
1
violation for water discharges in 202214
370
metric tons of hazardous waste generated
3
sanitary sewer overflows15 in 2022, totaling a volume of approximately 12 m3
14 In California, we received one violation for exceeding sanitary sewer permit discharge rate limitations. As corrective action, we installed a new tank to reduce the flow rate. No monetary fines were levied.
15 Sanitary sewer overflows to the environment refer to untreated or partially treated overflows, spills, releases, or diversions of wastewater from sanitary sewer systems under the Company’s ownership or operational control.
Sanitary Sewer Wastewater Treatment
Metric
Subsidiary
2022
Average volume of sanitary sewer wastewater16 treated per day in 2022 (m³ per day)
Cal Water
308
Hawaii Water
5148
New Mexico Water
1287
Washington Water
151
16 Sanitary sewer wastewater refers to wastewater liquid and waterborne wastes from residences, commercial buildings, industrial plants, and institutions, which is directed via a sanitary sewer system to treatment facilities for appropriate treatment. Sanitary sewers are distinct from combined sewers, which are designed to collect large volumes of stormwater in addition to sewage and industrial wastewater.