EXHIBIT 99.2
Published on February 25, 2026
Exhibit 99.2
Q4 and YE 2025 Earnings & Strong Start to 2026 February 26, 2026

Today’s Speakers 2 Marty Kropelnicki Chairman & CEO James Lynch Sr. Vice President, CFO & Treasurer Greg Milliman VP, Rates & Regulatory Affairs Shilen Patel Chief Business Development Officer & VP TWSC, Inc.
This presentation contains forward - looking statements within the meaning established by the Private Securities Litigation Reform Act of 1995 (“ PSLRA ”). The forward - looking statements are intended to qualify under provisions of the federal securities laws for “safe harbor” treatment established by the PSLRA . Forward - looking statements in this presentation are based on currently available information, expectations, estimates, assumptions and projections, and our management’s beliefs, assumptions, judgments and expectations a bou t us, the water utility industry and general economic conditions. These statements are not statements of historical fact. When used in our documents, statements that are not historical in nat ure , including words like will, would, expects, intends, plans, believes, may, could, estimates, assumes, anticipates, projects, progress, predicts, hopes, targets, forecasts, should, seeks or variations of these words or similar expressions are intended to identify forward - looking statements. Examples of forward - looking statements in this presentation include, but are not limited to, statements describing e xpectations regarding financial performance, operating plans, capital investments and expenditures, depreciation, expectations regarding California Water Service Group’s (Group or Company) plans and proposals pursuant to and progress of the California Water Service Company’s (Cal Water) 2024 General Rate Case, the anticipated closing and timing of acquisitions of Nexus Water Group’s Nevad a a nd Oregon utilities, and remaining outstanding membership interests in BVRT and expected benefits resulting from the Nevada, Oregon, and BVRT acquisitions, PFAS - related investments and receipt of PFA S settlement proceeds, rate base growth, customer growth potential, compound annual growth rate and annual dividend yield. Forward - looking statements are not guarantees of future performance. They are based on numerous assumptions that we believe are reasonable, but they are open to a wide range of uncertainties and business risks. Consequently, actual results or outcomes m ay vary materially from what is contained in a forward - looking statement. Factors that may cause actual results or outcomes to be different than those expected or anticipated include, but are not lim ite d to: the outcome and timeliness of regulatory commissions’ actions concerning rate relief and other matters, including with respect to the 2024 CA GRC and GRC’s of our other subsidiaries; the imp act of opposition to rate increases; our ability to recover costs; Federal governmental and state regulatory commissions’ decisions, including decisions on proper disposition of property; changes in s tat e regulatory commissions’ policies and procedures; changes in California State Water Resources Control Board water quality standards; changes in environmental compliance and water quality requiremen ts, EPA’s finalization of a National Primary Drinking Water Regulation establishing legally enforceable maximum contaminant levels (MCL) for PFAS in drinking water in 2024 as well as legal challe nge s to such MCLS; the impact of weather, climate change, natural disasters, including wildfires and landslides, and actual or threatened public health emergencies, including disease outbreaks, on our o per ations, water quality, water availability, water sales and operating results and the adequacy of our emergency preparedness; electric power interruptions, especially as a result of public safety power s hut off programs; availability of water supplies; our ability to invest or apply the proceeds from the issuance of common stock in an accretive manner; consequences of eminent domain actions relating to our wa ter systems; increased risk of inverse condemnation losses as a result of the impact of weather, climate change, and natural disasters, including wildfires and landslides; shifts in population, in clu ding housing and customer growth; issues with the implementation, maintenance or security of our information technology systems; physical and cyber security risks and threats and the adequacy of our efforts to mitigate such risks and threats; the ability of our enterprise risk management processes to identify or address risks adequately; labor relations matters as we negotiate with the unions; c han ges in customer water use patterns and the effects of conservation, including as a result of drought conditions; our ability to complete, in a timely manner or at all, successfully integrate an d a chieve anticipated benefits from announced acquisitions; including the Nevada, Oregon, and BVRT acquisitions; restrictive covenants in or changes to the credit ratings on our current or future debt that c oul d increase our financing costs or affect our ability to borrow, make payments on debt or pay dividends; risks associated with expanding our business and operations, including into other geographic areas; th e impact of stagnating or worsening business and economic conditions, including inflationary pressures, general economic slowdown or a recession, changes in tariff policy, the interest rate envir onm ent, changes in monetary policy, adverse capital markets activity or macroeconomic conditions as a result of geopolitical conflicts, and the prospect of shutdowns of the U.S. federal government; th e impact of market conditions and volatility on unrealized gains or losses on our non - qualified benefit plan investments and our operating results; the impact of weather and timing of meter reads on our accrued and unbilled revenue; the impact of evolving legal and regulatory requirements, including emerging sustainability requirements; the impact of the evolving U.S. political environment and chang es effected, proposed or threatened by the U.S. federal government that has led to, in some cases, legal challenges and uncertainty around the funding, functioning and policy priorities of U.S. federal re gulatory agencies and the status of current and future regulations; and other risks and unforeseen events described in our SEC filings. In light of these risks, uncertainties and assumptions, investors a re cautioned not to place undue reliance on forward - looking statements, which speak only as of the date of this presentation. When considering forward - looking statements, you should keep in mind the caution ary statements included in this paragraph, as well as the Annual Report on Form 10 - K, Quarterly 10 - Q, and other reports filed from time - to - time with the SEC. We are not under any obligation, and we ex pressly disclaim any obligation to update or alter any forward - looking statements, whether as a result of new information, future events or otherwise. A credit rating is not a recommendation to bu y, sell, or hold any securities, and may be changed at any time by the applicable ratings agency and should be evaluated independently of any other information. Forward - Looking Statements and Other Important Information 3
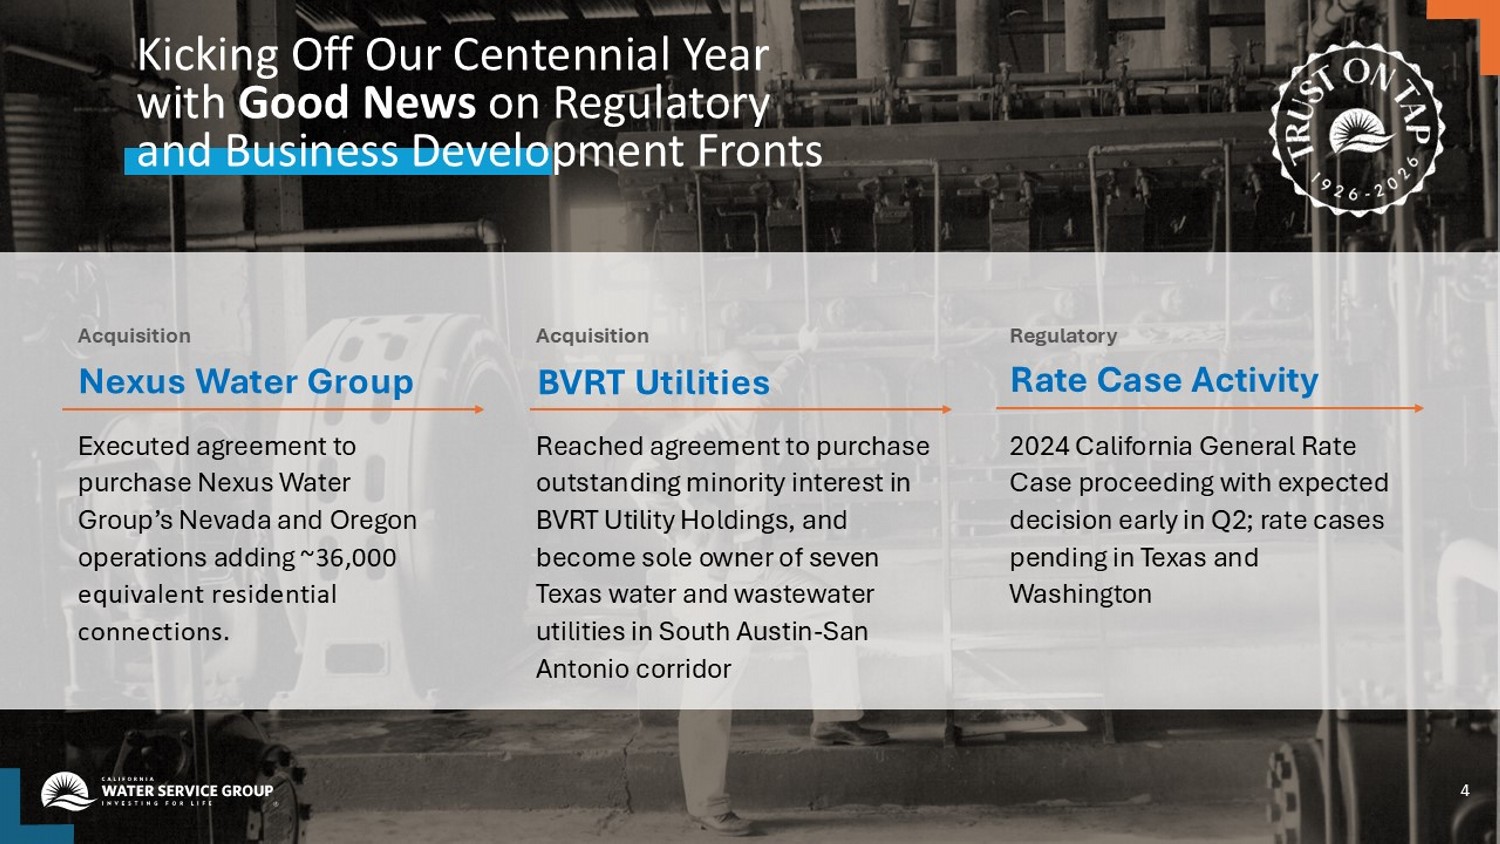
Kicking Off Our Centennial Year with Good News on Regulatory and Business Development Fronts 4 Reached agreement to purchase outstanding minority interest in BVRT Utility Holdings, and become sole owner of seven Texas water and wastewater utilities in South Austin - San Antonio corridor 2024 California General Rate Case proceeding with expected decision early in Q2; rate cases pending in Texas and Washington BVRT Utilities Rate Case Activity Acquisition Regulatory Executed agreement to purchase Nexus Water Group’s Nevada and Oregon operations adding ~36,000 equivalent residential connections. Nexus Water Group Acquisition
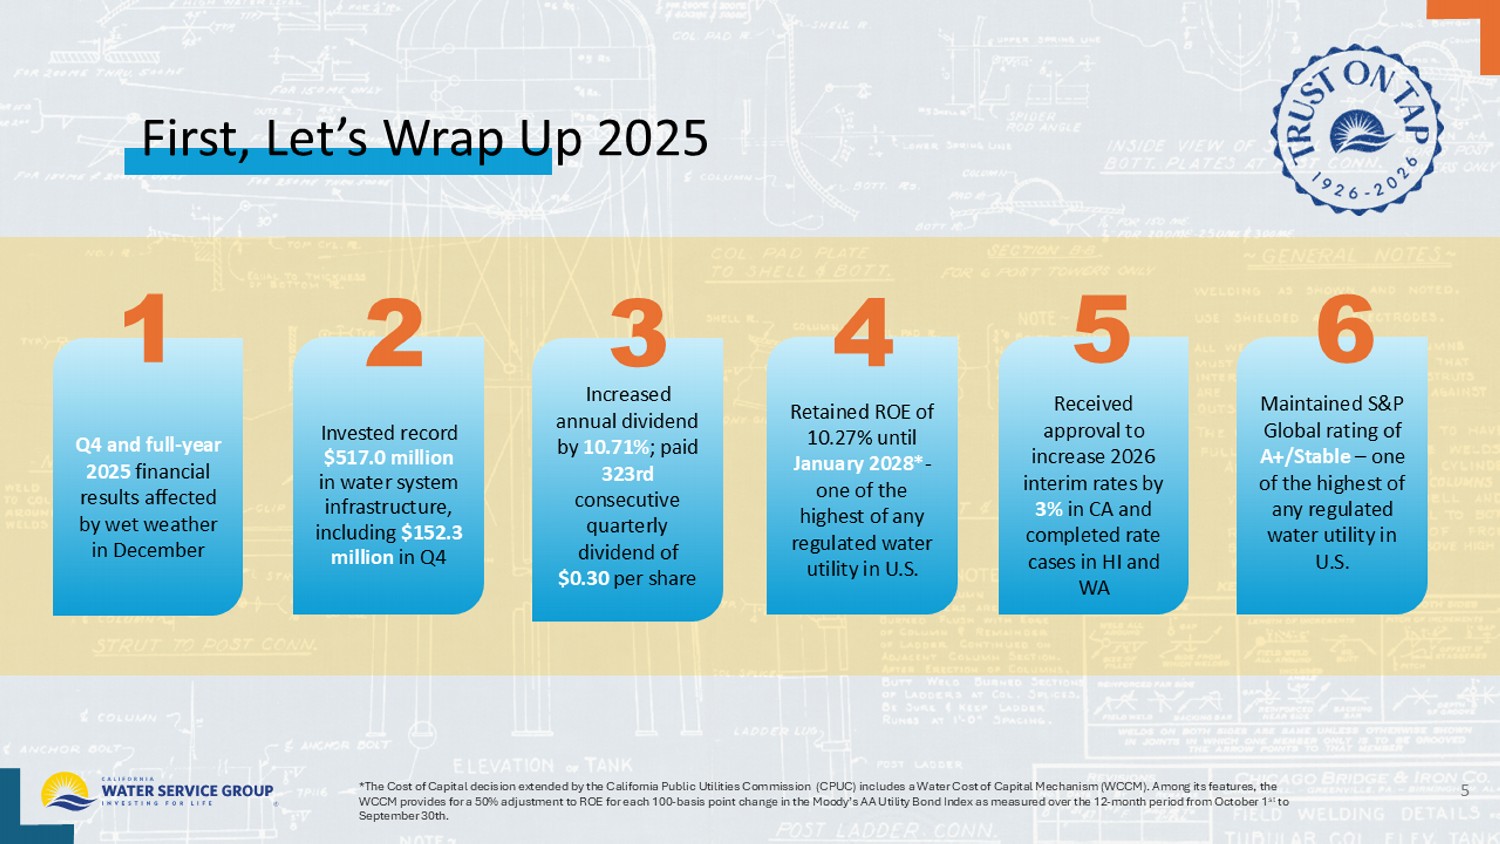
First, Let’s Wrap Up 2025 5 *The Cost of Capital decision extended by the California Public Utilities Commission (CPUC) includes a Water Cost of Capital Me chanism (WCCM). Among its features, the WCCM provides for a 50% adjustment to ROE for each 100 - basis point change in the Moody’s AA Utility Bond Index as measured over the 12 - month period from October 1 st to September 30th. Q4 and full - year 2025 financial results dampened by wet weather in December Invested $152.3 million in water system infrastructure in Q4, bringing 2025 Investment total to record $517.0 million Retained ROE of 10.27% until January 2028* - one of the highest of any regulated water utility in U.S. 1 2 Received approval to increase 2026 interim rates by 3% in CA and completed rate cases in HI and WA 5 Paid 323rd consecutive quarterly dividend of $0.30 per share 3 4 Retained S&P Global rating of A+/Stable – one of the highest of any regulated water utility in U.S. 6
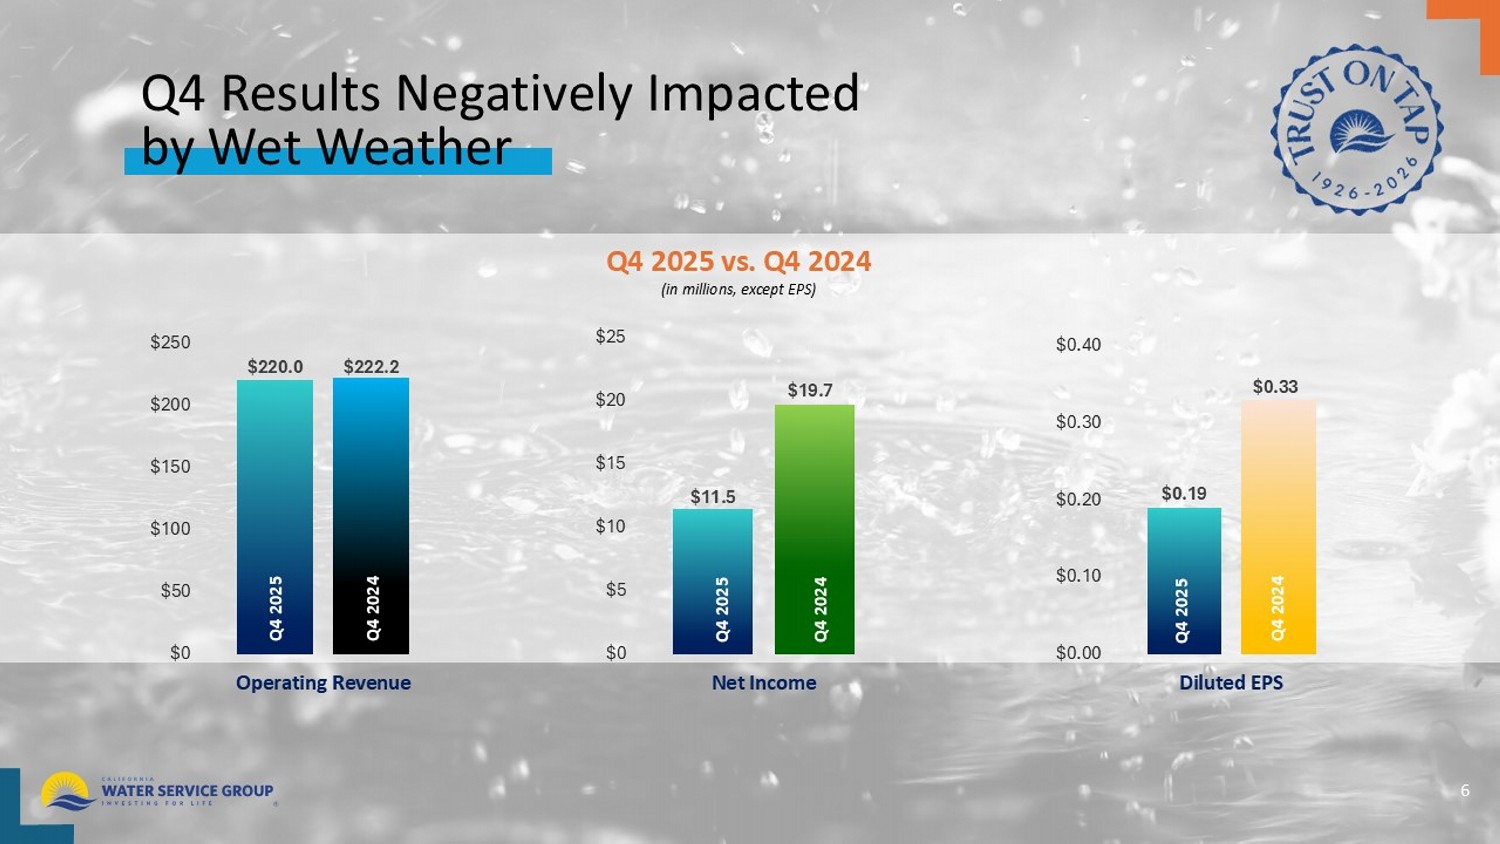
Q4 Results Negatively Impacted by Wet Weather 6 $220.0 $222.2 $0 $50 $100 $150 $200 $250 Operating Revenue $11.5 $19.7 $0 $5 $10 $15 $20 $25 Net Income $0.19 $0.33 $0.00 $0.10 $0.20 $0.30 $0.40 Diluted EPS Q4 2025 vs. Q4 2024 Q4 2024 Q4 2025 Q4 2024 Q4 2025 Q4 2024 Q4 2025 (in millions, except EPS)
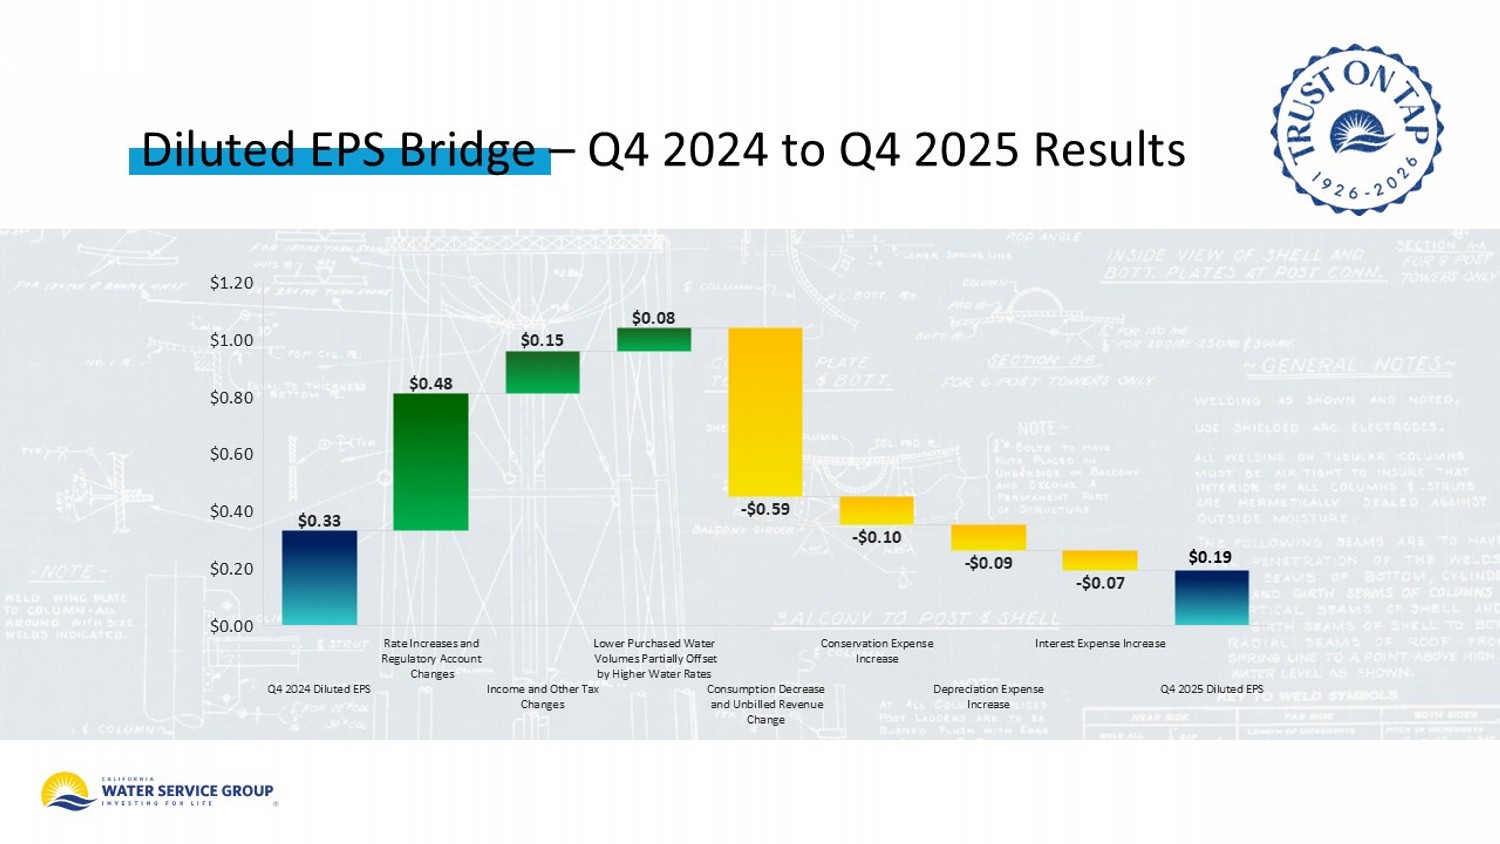
Diluted EPS Bridge – Q4 2024 to Q4 2025 Results $0.33 $0.48 $0.15 $0.08 - $0.59 - $0.10 - $0.09 - $0.07 Q4 2024 Diluted EPS Rate Increases and Regulatory Account Changes Income and Other Tax Changes Lower Purchased Water Volumes Partially Offset by Higher Water Rates Consumption Decrease and Unbilled Revenue Change Conservation Expense Increase Depreciation Expense Increase Interest Expense Increase Q4 2025 Diluted EPS $0.00 $0.20 $0.40 $0.60 $0.80 $1.00 $1.20 $0.19
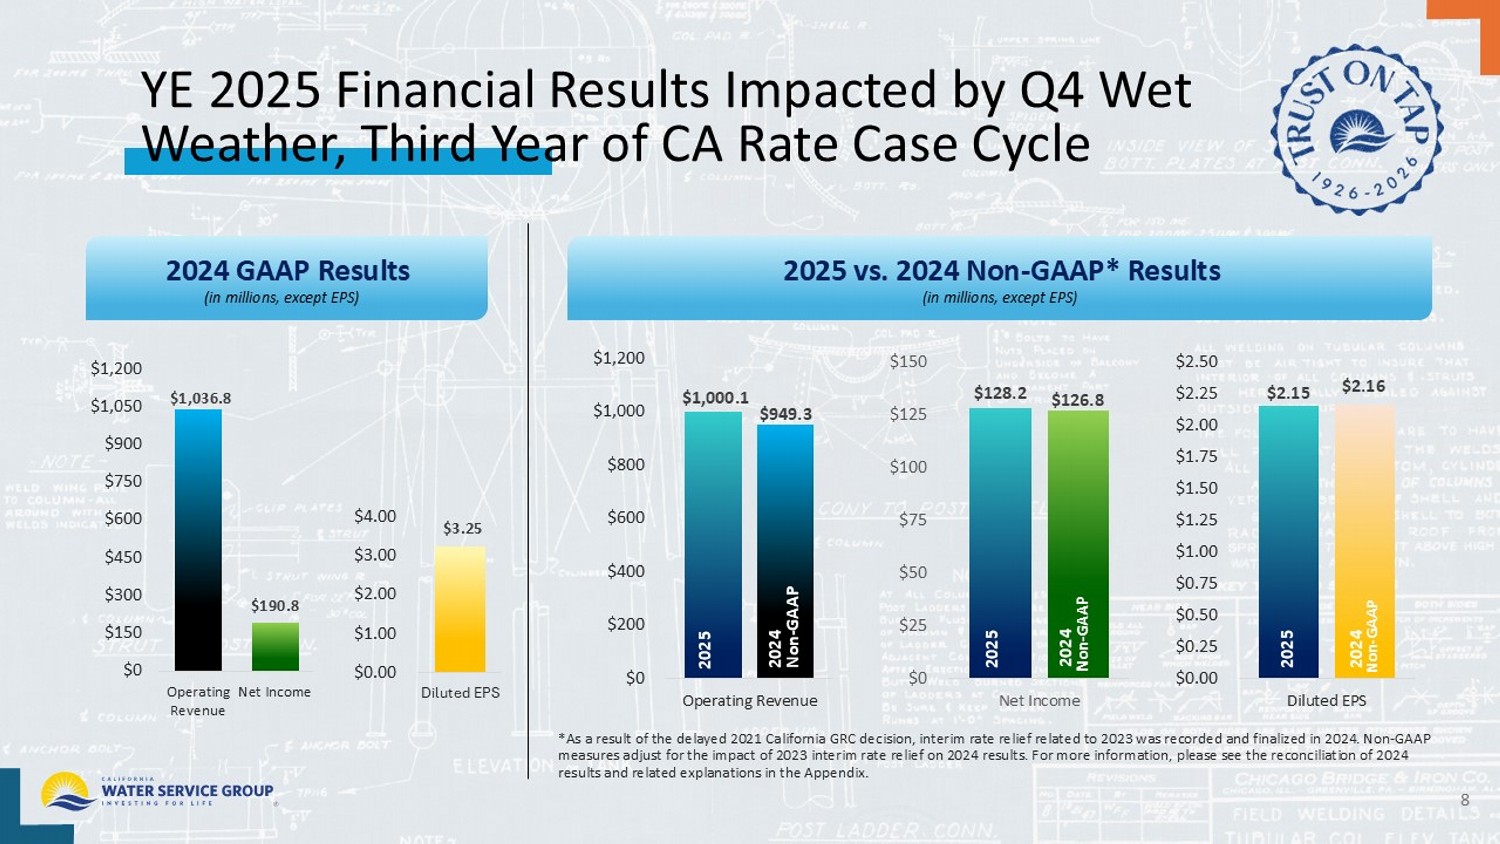
YE 2025 Financial Results Impacted by Q4 Wet Weather, Third Year of CA Rate Case Cycle (in millions, except EPS) $1,036.8 $190.8 $0 $150 $300 $450 $600 $750 $900 $1,050 $1,200 Operating Revenue Net Income $3.25 $0.00 $1.00 $2.00 $3.00 $4.00 Diluted EPS $1,000.1 $949.3 $0 $200 $400 $600 $800 $1,000 $1,200 Operating Revenue $128.2 $126.8 $0 $25 $50 $75 $100 $125 $150 Net Income $2.15 $2.16 $0.00 $0.25 $0.50 $0.75 $1.00 $1.25 $1.50 $1.75 $2.00 $2.25 $2.50 Diluted EPS 2025 vs. 2024 Non - GAAP* Results *As a result of the delayed 2021 California GRC decision, interim rate relief related to 2023 was recorded and finalized in 2 024 . Non - GAAP measures adjust for the impact of 2023 interim rate relief on 2024 results. For more information, please see the reconciliati on of 2024 results and related explanations in the Appendix. 2024 Non - GAAP 2025 2024 GAAP Results 2024 Non - GAAP 2025 2024 Non - GAAP 2025 (in millions, except EPS) 8
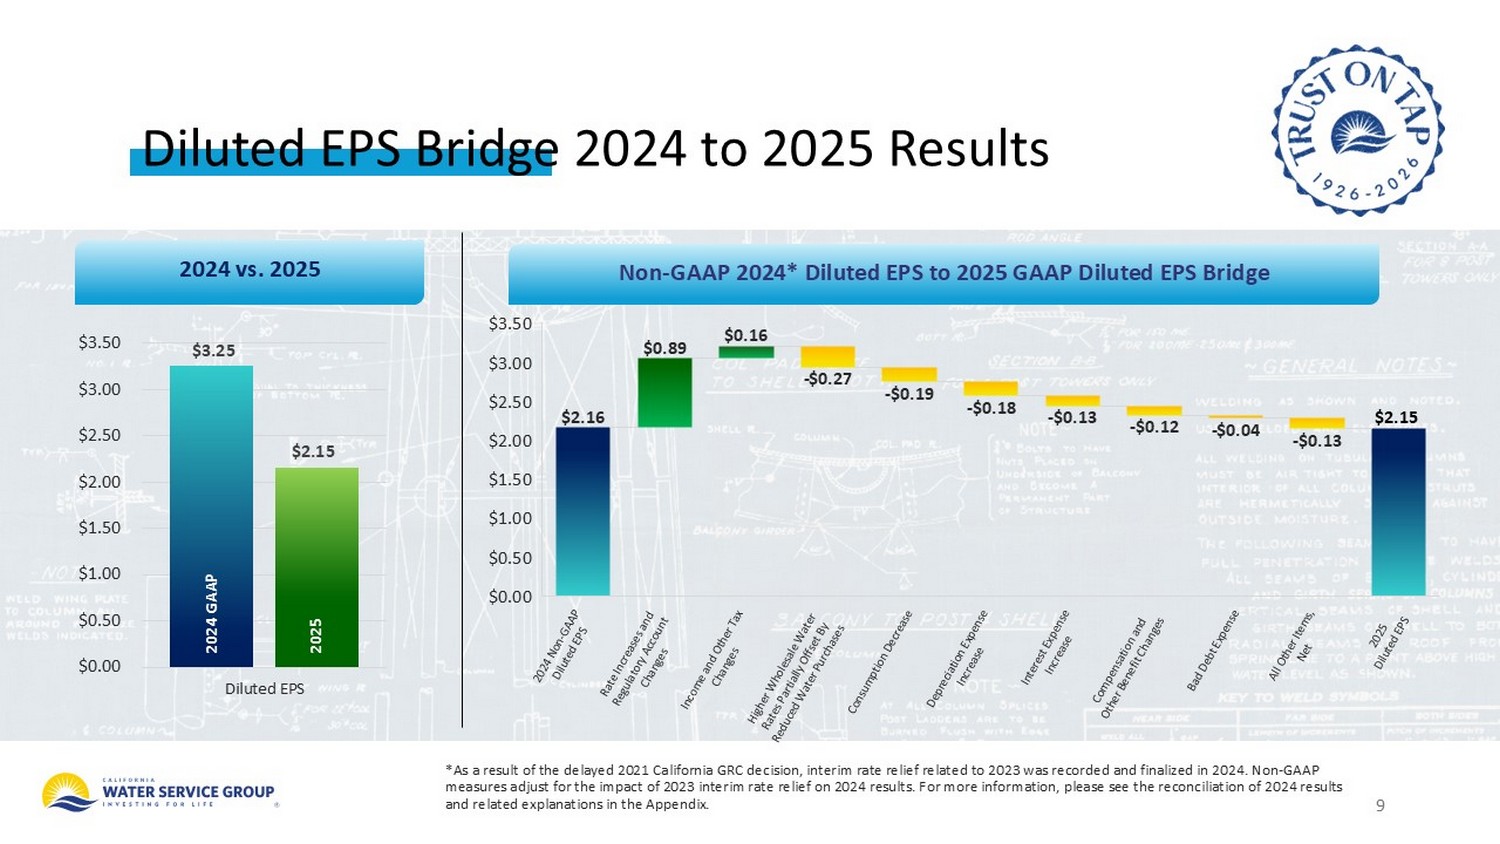
9 Diluted EPS Bridge 2024 to 2025 Results $3.25 $2.15 $0.00 $0.50 $1.00 $1.50 $2.00 $2.50 $3.00 $3.50 Diluted EPS 2024 vs. 2025 Non - GAAP 2024* Diluted EPS to 2025 GAAP Diluted EPS Bridge *As a result of the delayed 2021 California GRC decision, interim rate relief related to 2023 was recorded and finalized in 2 024 . Non - GAAP measures adjust for the impact of 2023 interim rate relief on 2024 results. For more information, please see the reconciliati on of 2024 results and related explanations in the Appendix. 2024 GAAP 2025 $2.16 $0.89 $0.16 - $0.27 - $0.19 - $0.18 - $0.13 - $0.12 - $0.04 - $0.13 $0.00 $0.50 $1.00 $1.50 $2.00 $2.50 $3.00 $3.50 $2.15
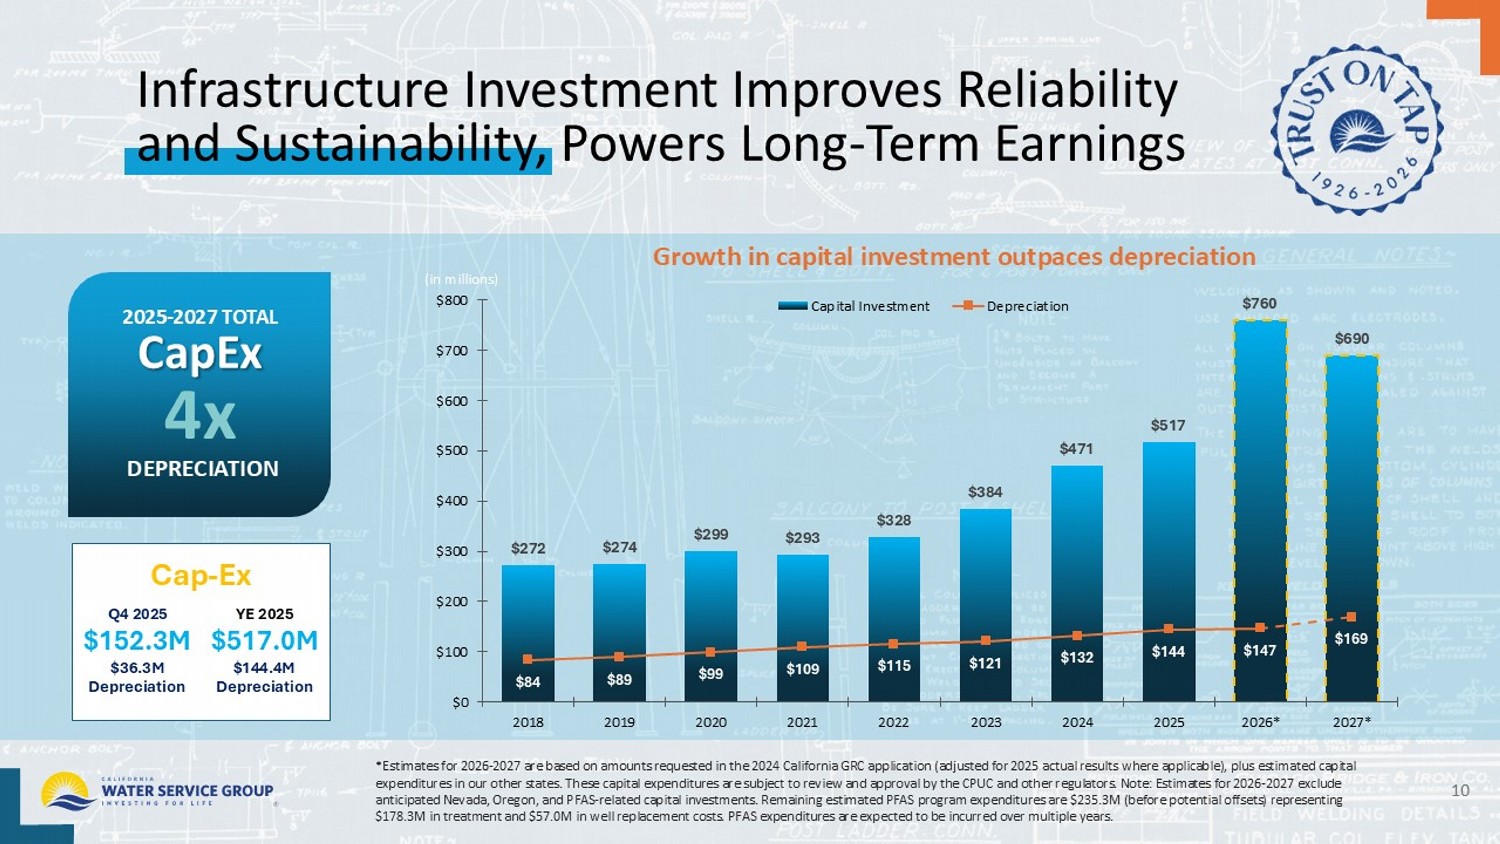
Infrastructure Investment Improves Reliability and Sustainability, Powers Long - Term Earnings 10 *Estimates for 2026 - 2027 are based on amounts requested in the 2024 California GRC application (adjusted for 2025 actual results where applicable), plus estimated capital expenditures in our other states. These capital expenditures are subject to review and approval by the CPUC and other regulat ors . Note: Estimates for 2026 - 2027 exclude anticipated Nevada, Oregon, and PFAS - related capital investments. Remaining estimated PFAS program expenditures are $235.3M (bef ore potential offsets) representing $178.3M in treatment and $57.0M in well replacement costs. PFAS expenditures are expected to be incurred over multiple years. $272 $274 $299 $293 $328 $384 $471 $517 $760 $690 $84 $89 $99 $109 $115 $121 $132 $144 $147 $169 $0 $100 $200 $300 $400 $500 $600 $700 $800 2018 2019 2020 2021 2022 2023 2024 2025 2026* 2027* Capital Investment Depreciation 2025 - 2027 TOTAL CapEx 4x DEPRECIATION (in millions) Growth in capital investment outpaces depreciation Q4 2025 $ 152.3M $ 36.3M Depreciation YE 2025 $ 517.0M $ 144.4M Depreciation Cap - Ex
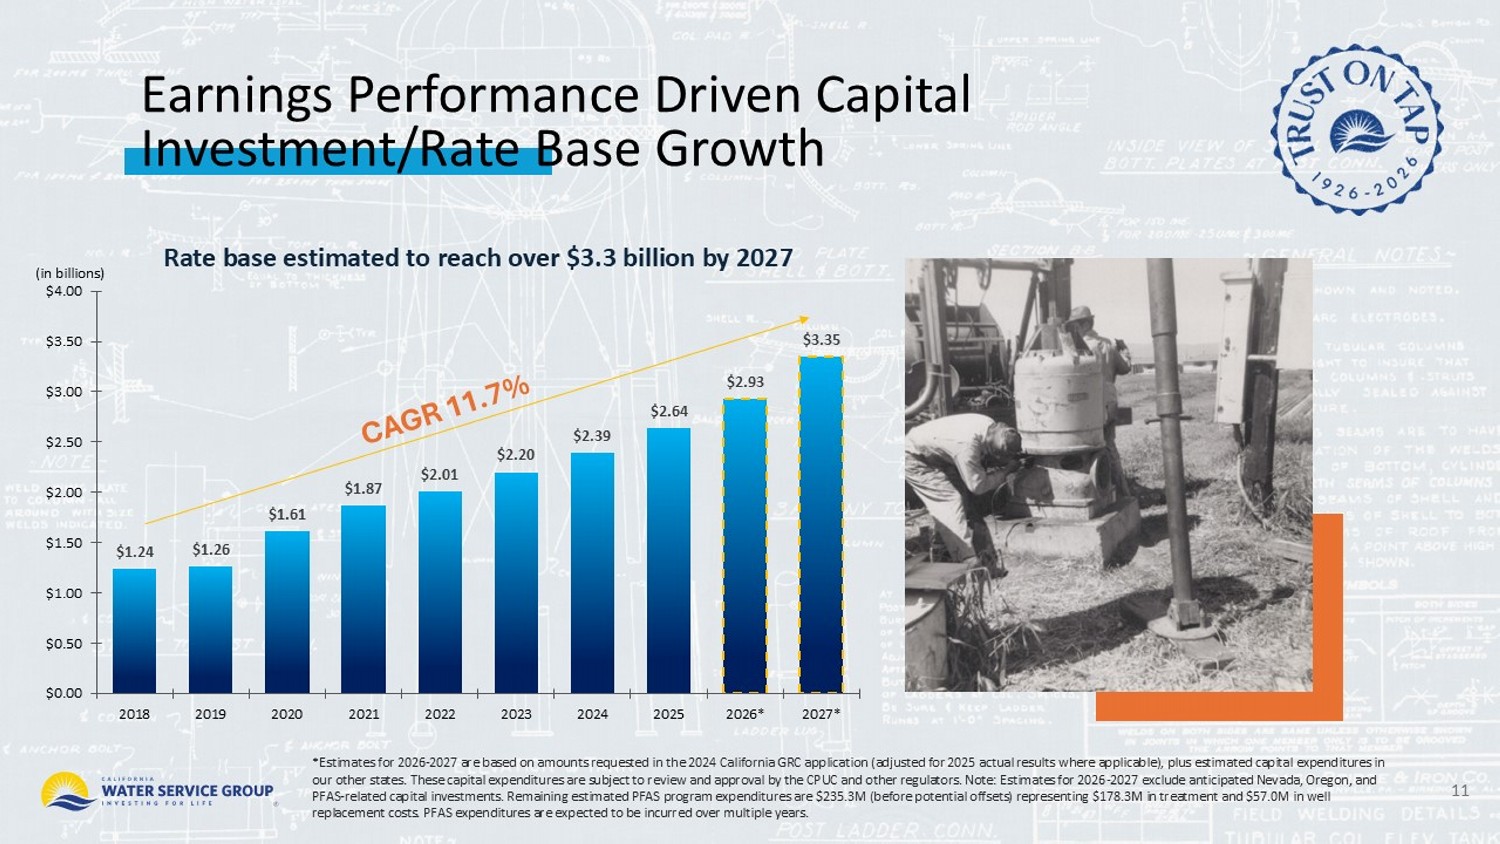
Earnings Performance Driven Capital Investment/Rate Base Growth 11 Rate base estimated to reach over $3.3 billion by 2027 *Estimates for 2026 - 2027 are based on amounts requested in the 2024 California GRC application (adjusted for 2025 actual results where applicable), plus estimated capital expenditures in our other states. These capital expenditures are subject to review and approval by the CPUC and other regulators. Note: Estim ate s for 2026 - 2027 exclude anticipated Nevada, Oregon, and PFAS - related capital investments. Remaining estimated PFAS program expenditures are $235.3M (before potential offsets) represent ing $178.3M in treatment and $57.0M in well replacement costs. PFAS expenditures are expected to be incurred over multiple years. $1.24 $1.26 $1.61 $1.87 $2.01 $2.20 $2.39 $2.64 $2.93 $3.35 $0.00 $0.50 $1.00 $1.50 $2.00 $2.50 $3.00 $3.50 $4.00 2018 2019 2020 2021 2022 2023 2024 2025 2026* 2027* (in billions)
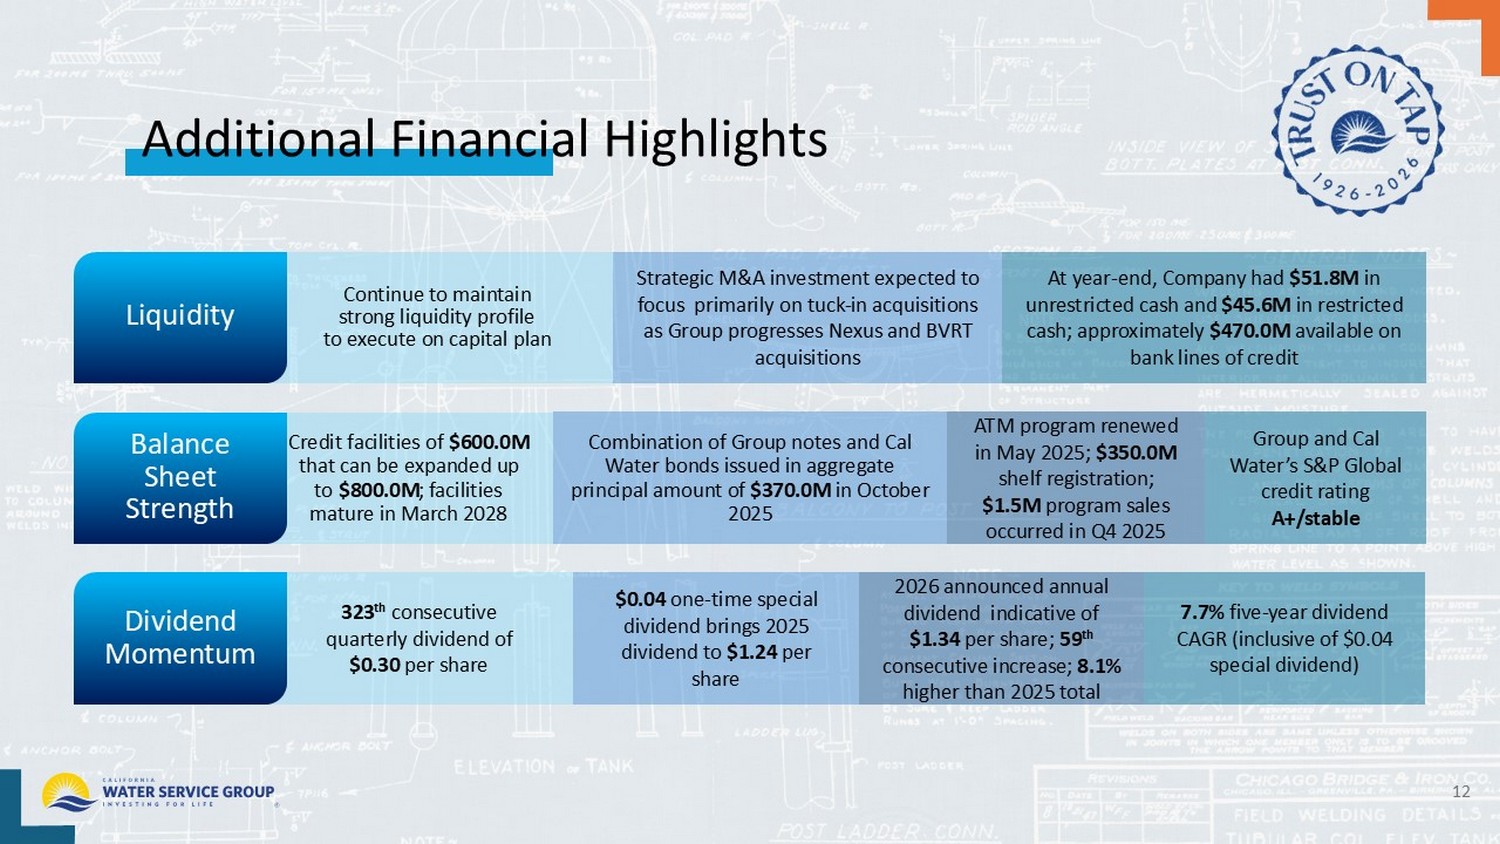
Additional Financial Highlights 12 323 th consecutive quarterly dividend of $0.30 per share $0.04 one - time special dividend brings 2025 dividend to $1.24 per share 2026 announced annual dividend indicative of $1.34 per share; 59 th consecutive increase; 8.1% higher than 2025 total 7.7% five - year dividend CAGR (inclusive of $0.04 special dividend) Credit facilities of $600.0M that can be expanded up to $800.0M ; facilities mature in March 2028 Combination of Group notes and Cal Water bonds issued in aggregate principal amount of $370.0M in October 2025 ATM program renewed in May 2025; $350.0M shelf registration; $1.5M program sales occurred in Q3 2025 Continue to maintain strong liquidity profile to execute on capital plan Liquidity Balance Sheet Strength Dividend Momentum Strategic M&A investment expected to focus primarily on tuck - in acquisitions as Group progresses Nexus and BVRT acquisitions At year - end, Company had $51.8M in unrestricted cash and $45.6M in restricted cash; approximately $470.0M available on bank lines of credit Group and Cal Water’s S&P Global credit rating A+/stable
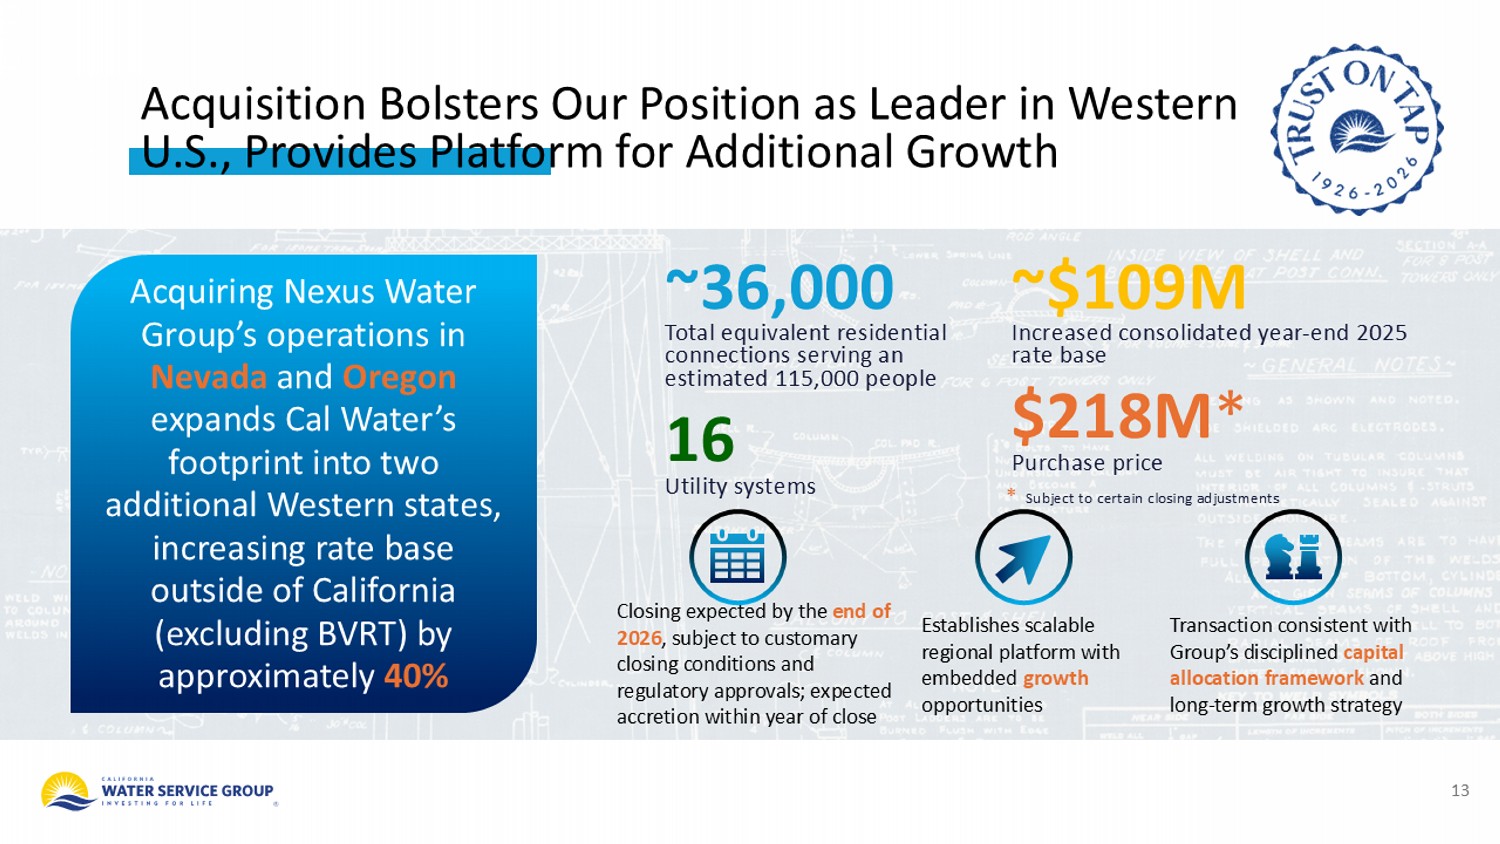
13 Acquisition Bolsters Our Position as Leader in Western U.S., Provides Platform for Additional Growth Closing expected by the end of 2026 , subject to customary closing conditions and regulatory approvals Transaction consistent with Group’s disciplined capital allocation framework and long - term growth strategy Establishes scalable regional platform with embedded growth opportunities Acquiring Nexus Water Group’s subsidiaries in Nevada and Oregon expands Cal Water’s footprint into two additional Western states, increasing rate base outside of California (excluding BVRT) by approximately 40% ~36,000 Total equivalent residential connections serving an estimated 115,000 people 16 Utility systems ~$109M Increased consolidated year - end 2025 rate base $218M * Purchase price * Subject to customary closing adjustments
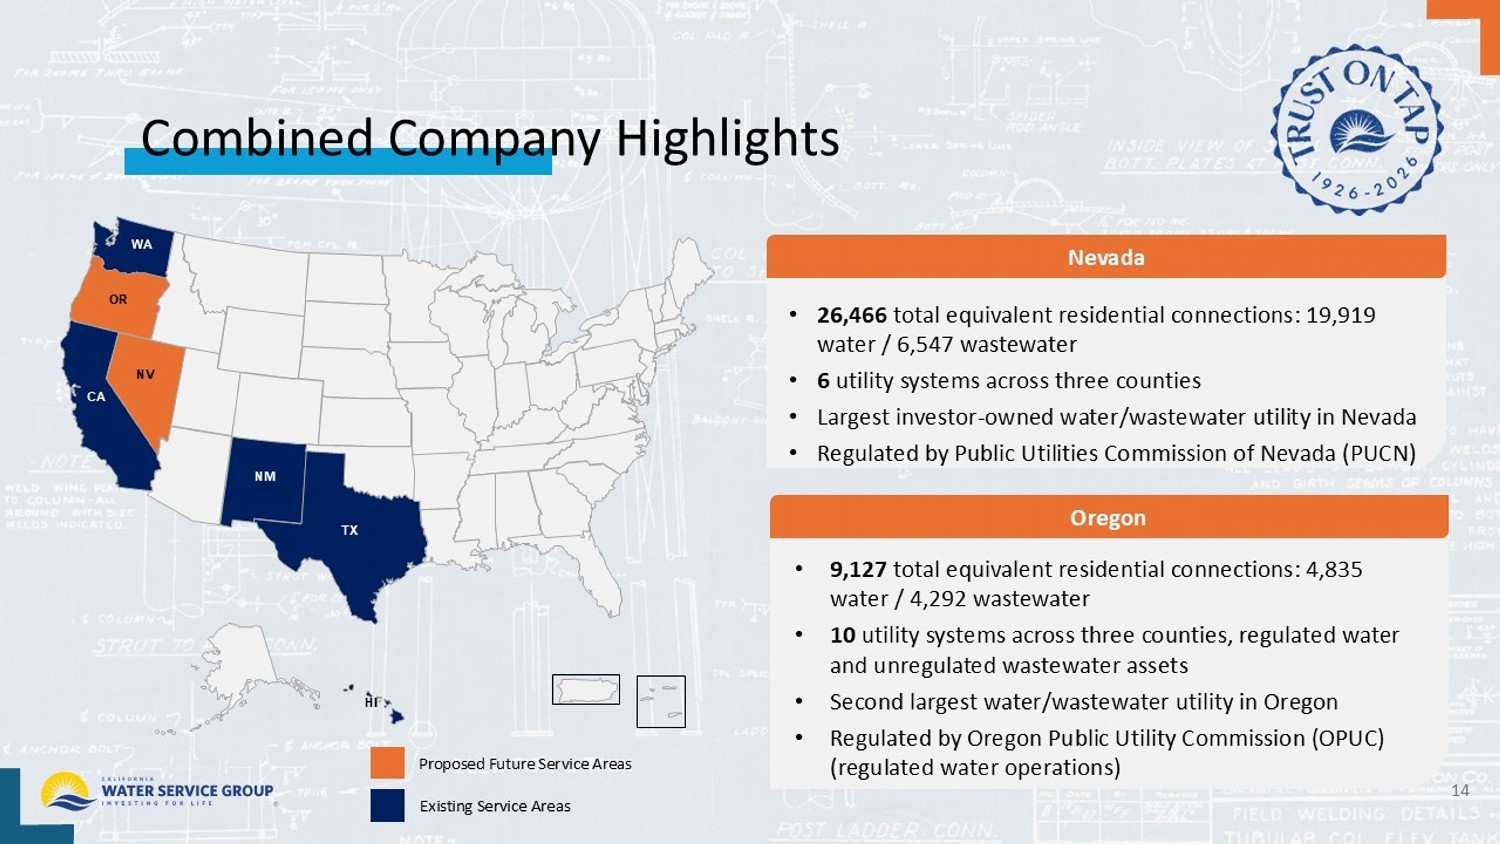
Combined Company Highlights 14 • 9,127 total equivalent residential connections: 4,835 water / 4,292 wastewater • 10 utility systems across three counties, regulated water and unregulated wastewater assets • Second largest water/wastewater utility in Oregon • Regulated by Oregon Public Utility Commission (OPUC) (regulated water operations) • 26,466 total equivalent residential connections: 19,919 water / 6,547 wastewater • 6 utility systems across three counties • Largest investor - owned water/wastewater utility in Nevada • Regulated by Public Utilities Commission of Nevada (PUCN) HI OR NV CA NM WA TX Proposed Future Service Areas Existing Service Areas Nevada Oregon
Strategic Rationale 15 Geographic diversification into Nevada and Oregon enhances regulatory and financial balance Acquires rate - base - driven growth platform with customer growth and capex investment opportunities Both states operate under hybrid ratemaking frameworks, supporting ongoing infrastructure investment Opportunity to optimize and allocate corporate and shared service costs over larger operational base benefit customers Strong historical regulatory relationships supported by successful rate case outcomes Embedded growth pipeline, both tuck - in acquisitions and customer connections Assets and operating profile consistent with Cal Water’s operating principles and operations
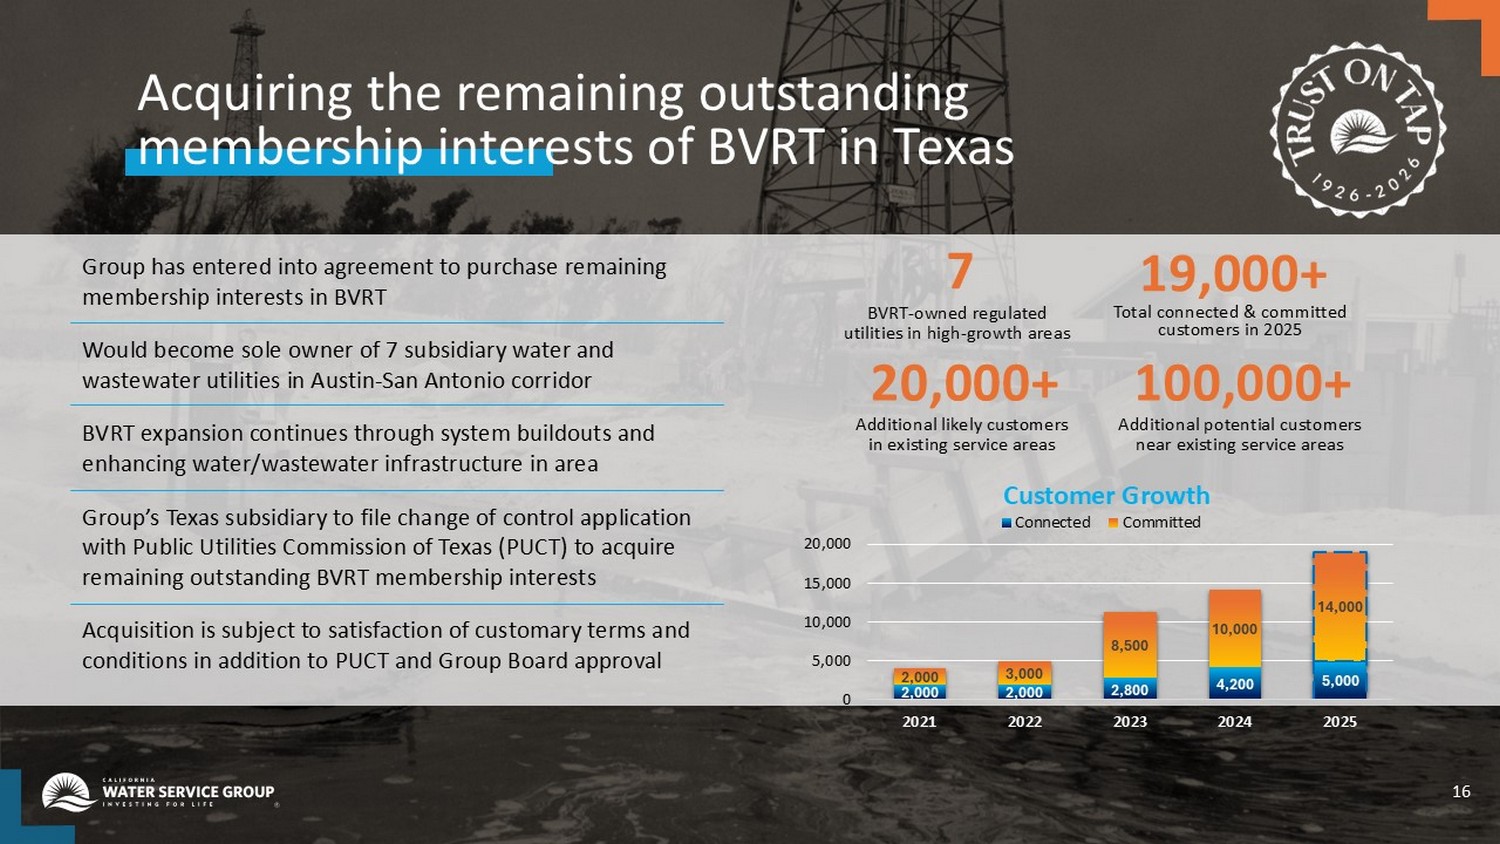
Acquiring the remaining outstanding membership interests of BVRT in Texas 16 2,000 2,000 2,800 4,200 5,000 2,000 3,000 8,500 10,000 14,000 0 5,000 10,000 15,000 20,000 2021 2022 2023 2024 2025 Customer Growth Connected Committed 19,000+ Total connected & committed customers in 2025 20,000+ Additional likely customers in existing service areas 100,000+ Additional potential customers near existing service areas 7 BVRT - owned regulated utilities in high - growth areas Group has entered into agreement to purchase remaining outstanding membership interests in BVRT Would become sole owner of 7 subsidiary water and wastewater utilities in Austin - San Antonio corridor BVRT expansion continues through system buildouts and enhancing water/wastewater infrastructure in area Group’s Texas subsidiary to file change of control application with Public Utilities Commission of Texas (PUCT) to acquire remaining outstanding BVRT membership interests Acquisition is subject to satisfaction of customary terms and conditions in addition to PUCT and Group Board approval
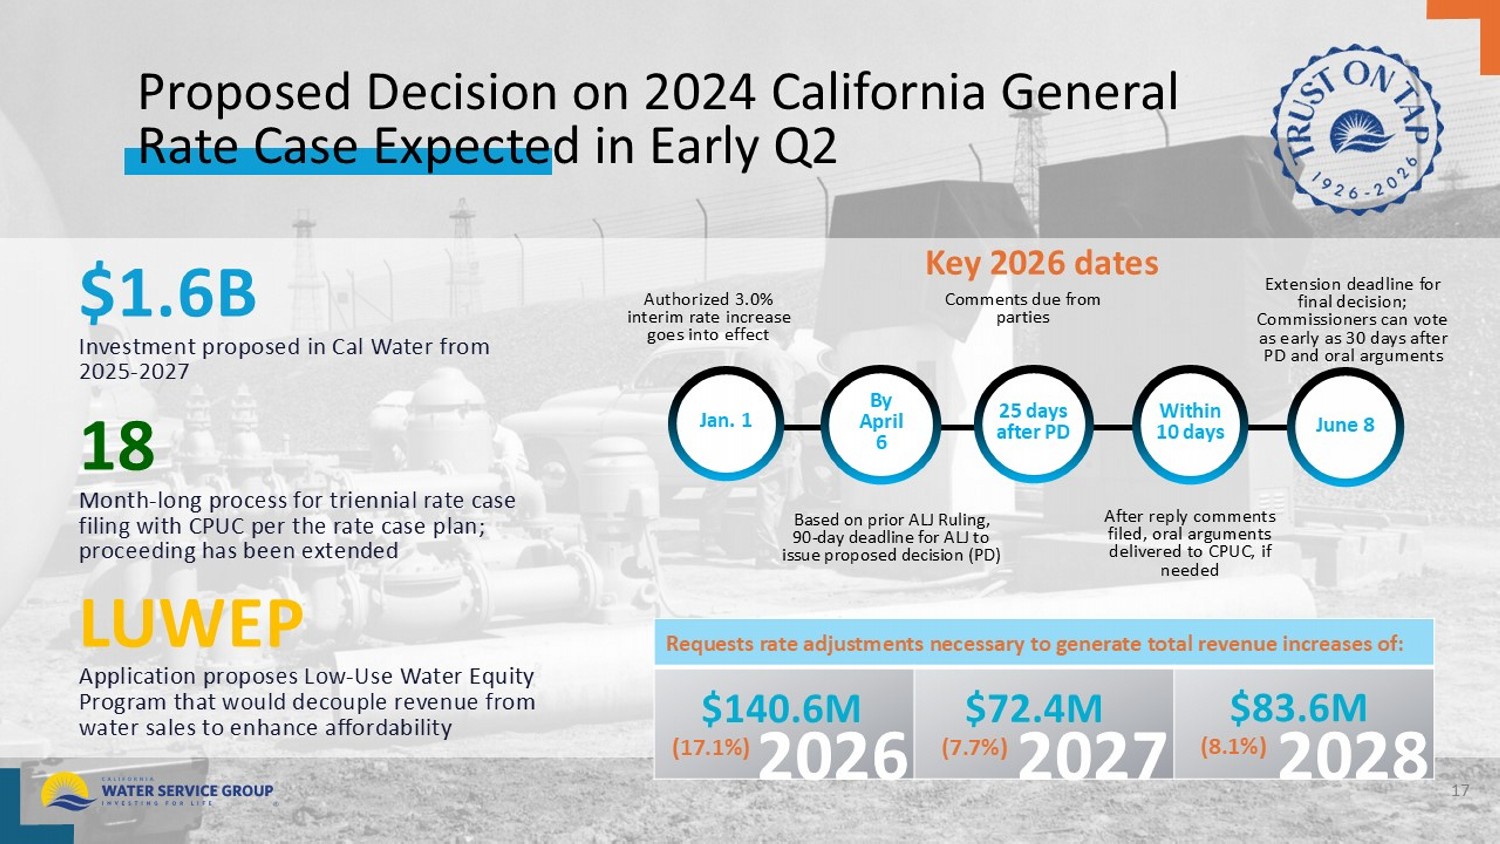
Proposed Decision on 2024 California General Rate Case Expected in Early Q2 17 $ 1.6B Investment proposed in Cal Water from 2025 - 2027 18 Month - long process for triennial rate case filing with CPUC per the rate case plan; proceeding has been extended LUWEP Application proposes Low - Use Water Equity Program that would decouple revenue from water sales to enhance affordability Key 2026 dates Requests rate adjustments necessary to generate total revenue increases of: 2026 2027 2028 $140.6M (17.1%) $ 83.6M (8.1%) $72.4M (7.7%) Authorized 3.0% interim rate increase goes into effect Based on prior ALJ Ruling, 90 - day deadline for ALJ to issue proposed decision (PD) Comments due from parties After reply comments filed, oral arguments delivered to CPUC, if needed Extension deadline for final decision; Commissioners can vote as early as 30 days after PD and oral arguments Jan. 1 By April 6 25 days after PD Within 10 days June 8
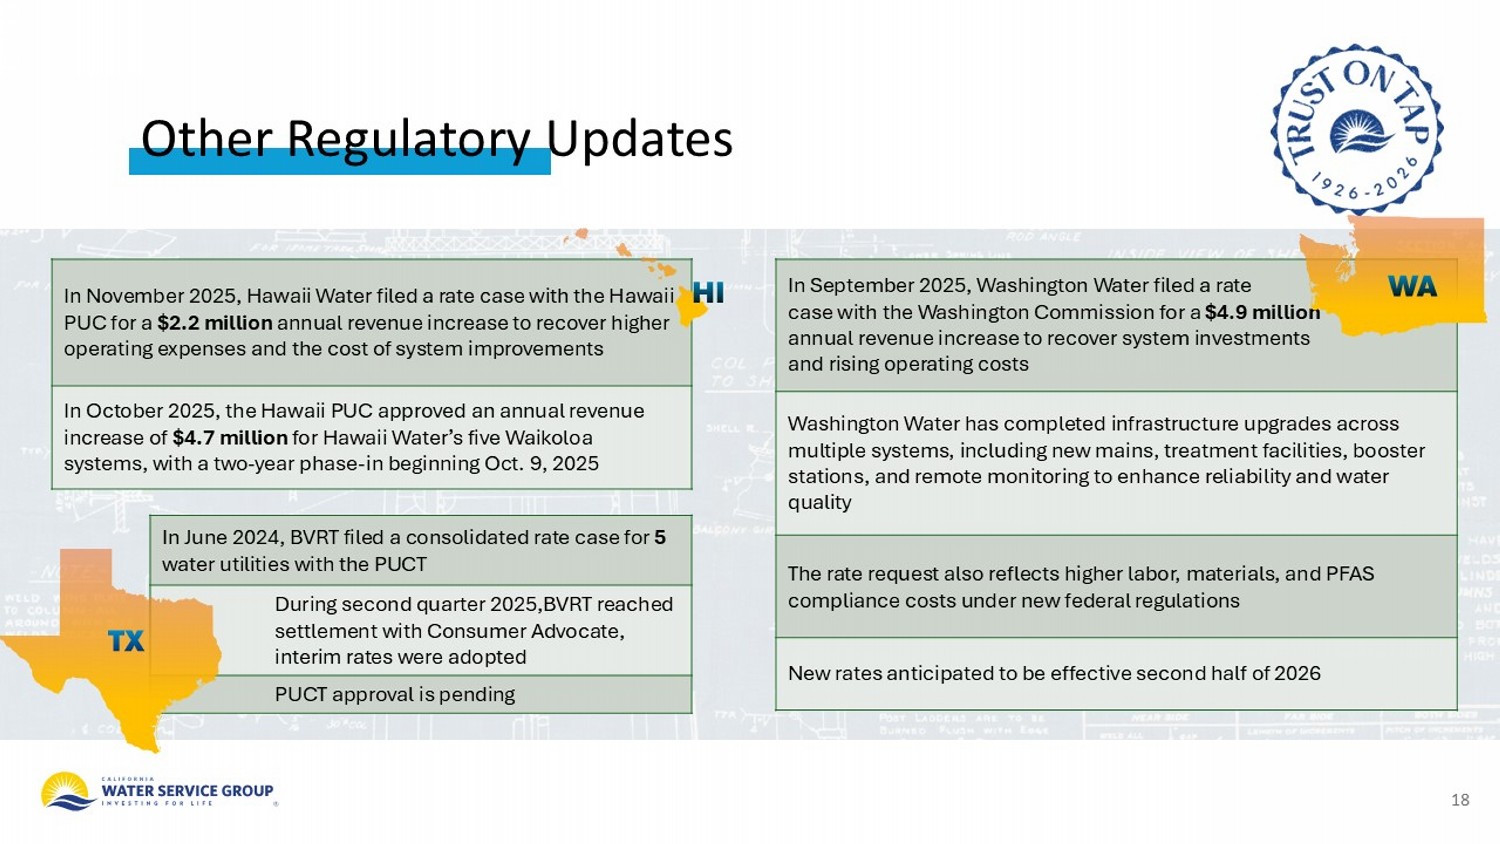
Other Regulatory Updates In November 2025, Hawaii Water filed a rate case with the Hawaii PUC for a $2.2 million annual revenue increase to recover higher operating expenses and the cost of system improvements In October 2025, the Hawaii PUC approved an annual revenue increase of $4.7 million for Hawaii Water’s five Waikoloa systems, with a two - year phase - in beginning Oct. 9, 2025 In June 2024, BVRT filed a consolidated rate case for 5 water utilities with the PUCT During second quarter 2025,BVRT reached settlement with Consumer Advocate, interim rates were adopted PUCT approval is pending In September 2025, Washington Water filed a rate case with the Washington Commission for a $4.9 million annual revenue increase to recover system investments and rising operating costs Washington Water has completed infrastructure upgrades across multiple systems, including new mains, treatment facilities, booster stations, and remote monitoring to enhance reliability and water quality The rate request also reflects higher labor, materials, and PFAS compliance costs under new federal regulations New rates anticipated to be effective second half of 2026 18
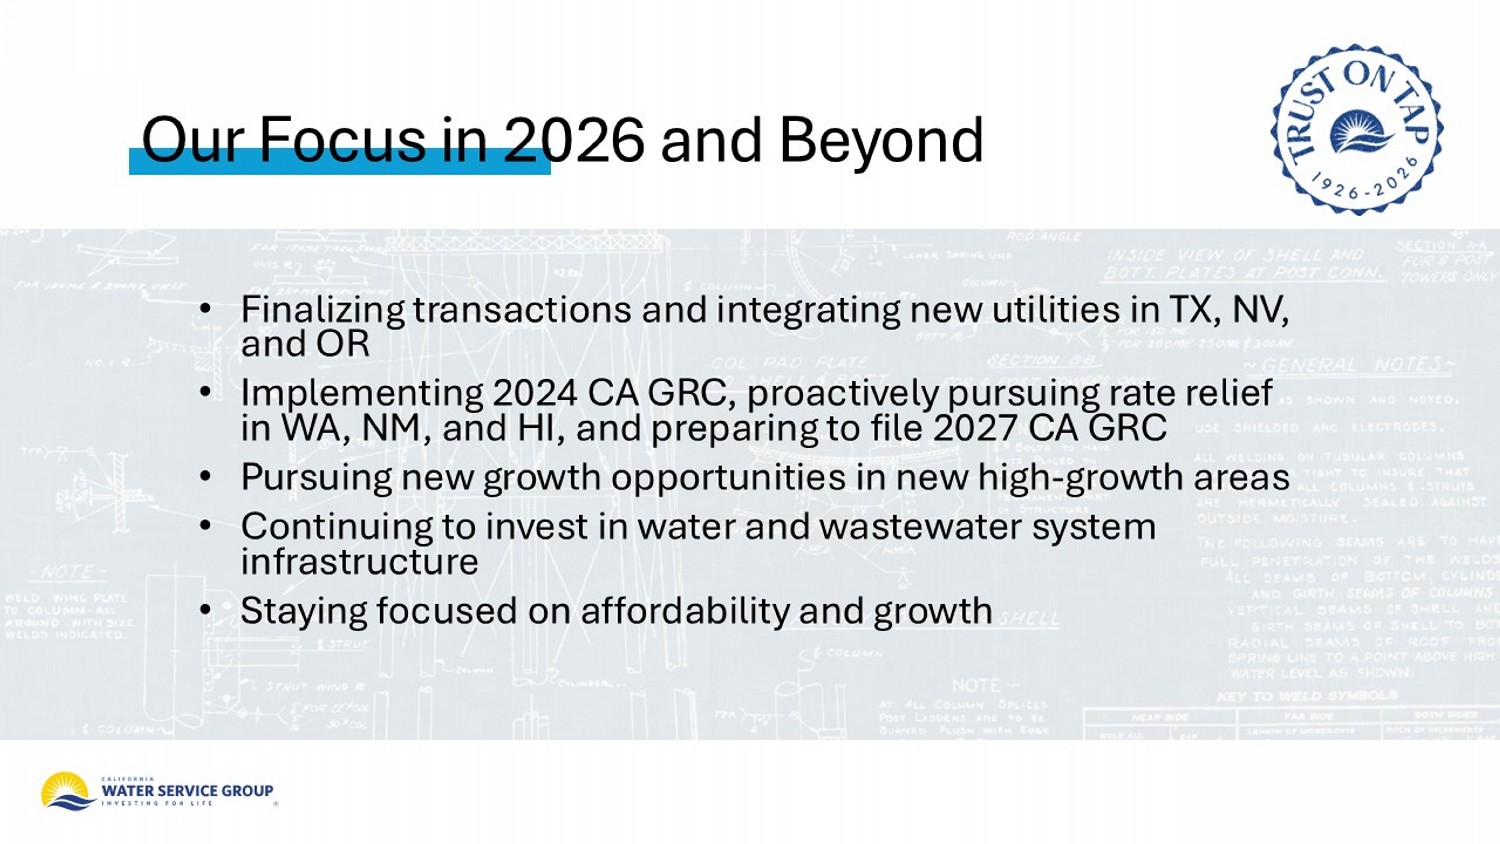
• Finalizing transactions and integrating new utilities in TX, NV, and OR • Implementing 2024 CA GRC, proactively pursuing rate relief in WA, NM, and HI, and preparing to file 2027 CA GRC • Pursuing new growth opportunities in new high - growth areas • Continuing to invest in water and wastewater system infrastructure • Staying focused on affordability and growth Our Focus in 2026 and Beyond
Appendix
The Company’s revenue, net income, and diluted earnings per share are prepared in accordance with Generally Accepted Accounting Principles (GAAP) and represent amounts reported on filings with the Securities and Exchange Commission. Adjusted revenue, net income, and diluted earnings per share in YTD 2024 are non - GAAP financial measures representing GAAP balances that, in this presentation, are adjusted for the effects of 2023 interim rate relief related to the delayed 2021 California GRC recorded by the Company in March 2024. These non - GAAP financial measures are provided as additional information for investors and analysts to better assess the Company’s 2024 financial performance and normalize for the impact of the 2023 interim rate relief on 2024 reported results. Management also uses these non - GAAP financial measures in evaluating the Company’s performance. These non - GAAP financial measures may be different from non - GAAP financial measures used by other companies, even when the same or similarly titled terms are used to identify such measures, limiting their usefulness for comparative purposes. Further, these non - GAAP financial measures should be considered as a supplement to the financial information prepared on a GAAP basis rather than an alternative to the respective GAAP measures. Non - GAAP Financial Measures 21
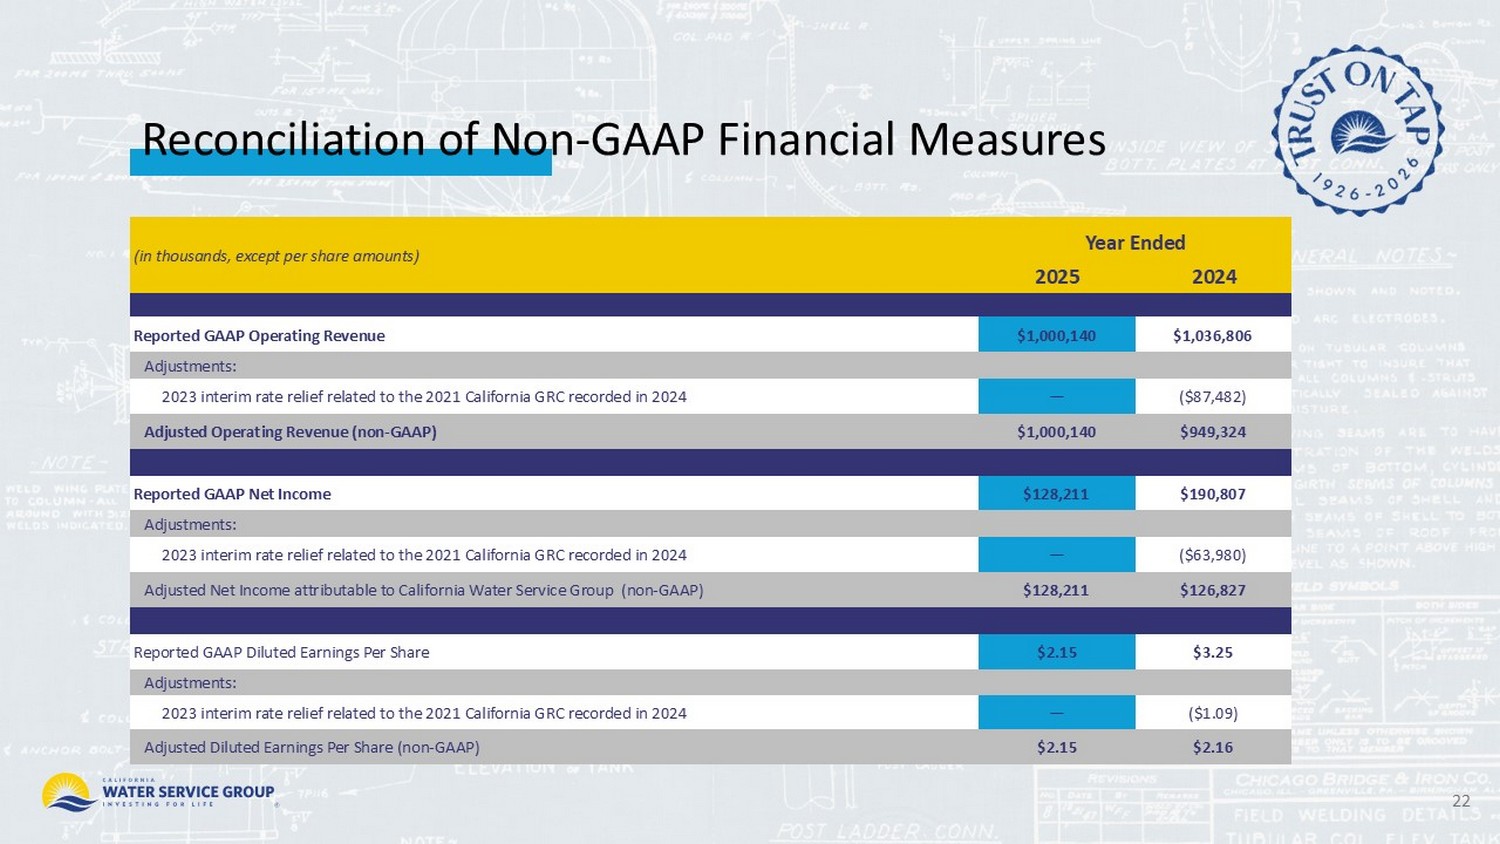
Reconciliation of Non - GAAP Financial Measures 22 Year Ended (in millions, except per share amounts) 2024 2025 $1,036,806 $1,000,140 Reported GAAP Operating Revenue Adjustments: ($87,482) — 2023 interim rate relief related to the 2021 California GRC recorded in 2024 $949,324 $1,000,140 Adjusted Operating Revenue (non - GAAP) $190,807 $128,211 Reported GAAP Net Income Adjustments: ($63,980) — 2023 interim rate relief related to the 2021 California GRC recorded in 2024 $126,827 $128,211 Adjusted Net Income attributable to California Water Service Group (non - GAAP) $3.25 $2.15 Reported GAAP Diluted Earnings Per Share Adjustments: ($1.09) — 2023 interim rate relief related to the 2021 California GRC recorded in 2024 $2.16 $2.15 Adjusted Diluted Earnings Per Share (non - GAAP)