EXHIBIT 99.2
Published on October 30, 2025
Exhibit 99.2
©2025 California Water Service Group 1 ©2025 California Water Service Group Investing for Life Third Quarter 2025 Earnings Presentation October 30, 2025 ©2025 California Water Service Group
©2025 California Water Service Group 2 ©2025 California Water Service Group Today’s Speakers Marty Kropelnicki Chairman & CEO James Lynch Sr. Vice President, CFO & Treasurer Greg Milleman Vice President, Rates & Regulatory Affairs
©2025 California Water Service Group 3 Forward - Looking Statements and Other Important Information This presentation contains forward - looking statements within the meaning established by the Private Securities Litigation Reform Act of 1995 (“ PSLRA ”). The forward - looking statements are intended to qualify under provisions of the federal securities laws for “safe harbor” treatment established by the PSLRA . Forward - looking statements in this presentation are based on currently available information, expectations, estimates, assumpt ions and projections, and our management’s beliefs, assumptions, judgments and expectations about us, the water utility industry and g ene ral economic conditions. These statements are not statements of historical fact. When used in our documents, statements that are not historical in nature, including words like will, would, expects, intends, plans, belie ves , may, could, estimates, assumes, anticipates, projects, progress, predicts, hopes, targets, forecasts, should, seeks or variations of these words or similar expressions are intended to identify forward - looking statements. Examples of forward - looking statements in this presentation include, but are not limited to, statements describing expectations regarding financial performance, operating plans, capital investments and expenditures, depreciation, ex pectations regarding California Water Service Group’s (Group or Company) plans and proposals pursuant to and progress of the California Water Service Company’s (Cal Water) 2024 General Rate Case, the anticipated transf er of ownership pursuant to and expected benefits resulting from the Silverwood agreement, PFAS - related investments and receipt of PFAS settlement proceeds, rate base growth, customer growth potential, compound annual g rowth rate, sufficiency of cash and liquidity to support capital investment and growth, and annual dividend yield. Forward - looking statements are not guarantees of future performance. They are based on numerous assumptio ns that we believe are reasonable, but they are open to a wide range of uncertainties and business risks. Consequently, actual results or outcomes may vary materially from what is contained in a forward - looking stateme nt. Factors that may cause actual results or outcomes to be different than those expected or anticipated include, but are not limited to: the outcome and timeliness of regulatory commissions’ actions concerning rate re lie f and other matters, including with respect to the 2024 GRC ; the impact of opposition to rate increases; our ability to recover costs; Federal governmental and state regulatory commissions’ decisions, including decision s o n proper disposition of property; changes in state regulatory commissions’ policies and procedures, such as the CPUC’s decision in 2020 to preclude companies from proposing fully decoupled WRAMs , which impacted the 2021 GRC Filing; changes in California State Water Resources Control Board water quality standards; changes in environmental compliance and water quality requirements, such as the United States Environmental Protection Agency ’s (EPA) finalization of a National Primary Drinking Water Regulation establishing legally enforceable maximum contaminant levels (MCL) for six PFAS in drinking water in 2024; the impact of weather, climate change, n atu ral disasters, including wildfires and landslides, and actual or threatened public health emergencies, including disease outbreaks, on our operations, water quality, water availability, water sales and operating res ult s and the adequacy of our emergency preparedness; electric power interruptions, especially as a result of public safety power shutoff programs; availability of water supplies; our ability to invest or apply the proceeds f rom the issuance of common stock in an accretive manner; consequences of eminent domain actions relating to our water systems; our ability to renew leases to operate water systems owned by others on beneficial terms; incr eas ed risk of inverse condemnation losses as a result of the impact of weather, climate change, and natural disasters, including wildfires and landslides; housing and customer growth; issues with the implementation, maintenan ce or security of our information technology systems; civil disturbances or terrorist threats or acts; the adequacy of our efforts to mitigate physical and cyber security risks and threats; the ability of our enterprise risk man age ment processes to identify or address risks adequately; labor relations matters as we negotiate with the unions; changes in customer water use patterns and the effects of conservation, including as a result of drought conditio ns; our ability to complete, in a timely manner or at all, successfully integrate and achieve anticipated benefits from announced acquisitions; restrictive covenants in or changes to the credit ratings on our current or future debt th at could increase our financing costs or affect our ability to borrow, make payments on debt or pay dividends; risks associated with expanding our business and operations geographically; the impact of stagnating or worsening bus iness and economic conditions, including inflationary pressures, general economic slowdown or a recession, changes in tariff policy and uncertainty regarding tariffs and other retaliatory trade measures, the interest rate environment, changes in monetary policy, adverse capital markets activity or macroeconomic conditions as a result of geopolitical conflicts; the impact of market conditions and volatility on unrealized gains or losse s o n our non - qualified benefit plan investments and our operating results; the impact of weather and timing of meter reads on our accrued unbilled revenue; the impact of evolving legal and regulatory requirements, including em erg ing environmental, social and governance requirements; the impact of the evolving U.S. political environment that has led to, in some cases, legal challenges and uncertainty around the funding, functioning and policy prior iti es of U.S. federal regulatory agencies and the status of current and future regulations; and other risks and unforeseen events described in our Securities and Exchange Commission (“SEC”) filings. In light of these risks, unc ert ainties and assumptions, investors are cautioned not to place undue reliance on forward - looking statements, which speak only as of the date of this presentation. When considering forward - looking statements, you should keep i n mind the cautionary statements included in this paragraph, as well as the Annual Report on Form 10 - K, Quarterly 10 - Q, and other reports filed from time - to - time with the SEC. We are not under any obligation, and we expre ssly disclaim any obligation to update or alter any forward - looking statements, whether as a result of new information, future events or otherwise. A credit rating is not a recommendation to buy, sell, or hold any secu rit ies, and may be changed at any time by the applicable ratings agency and should be evaluated independently of any other information.
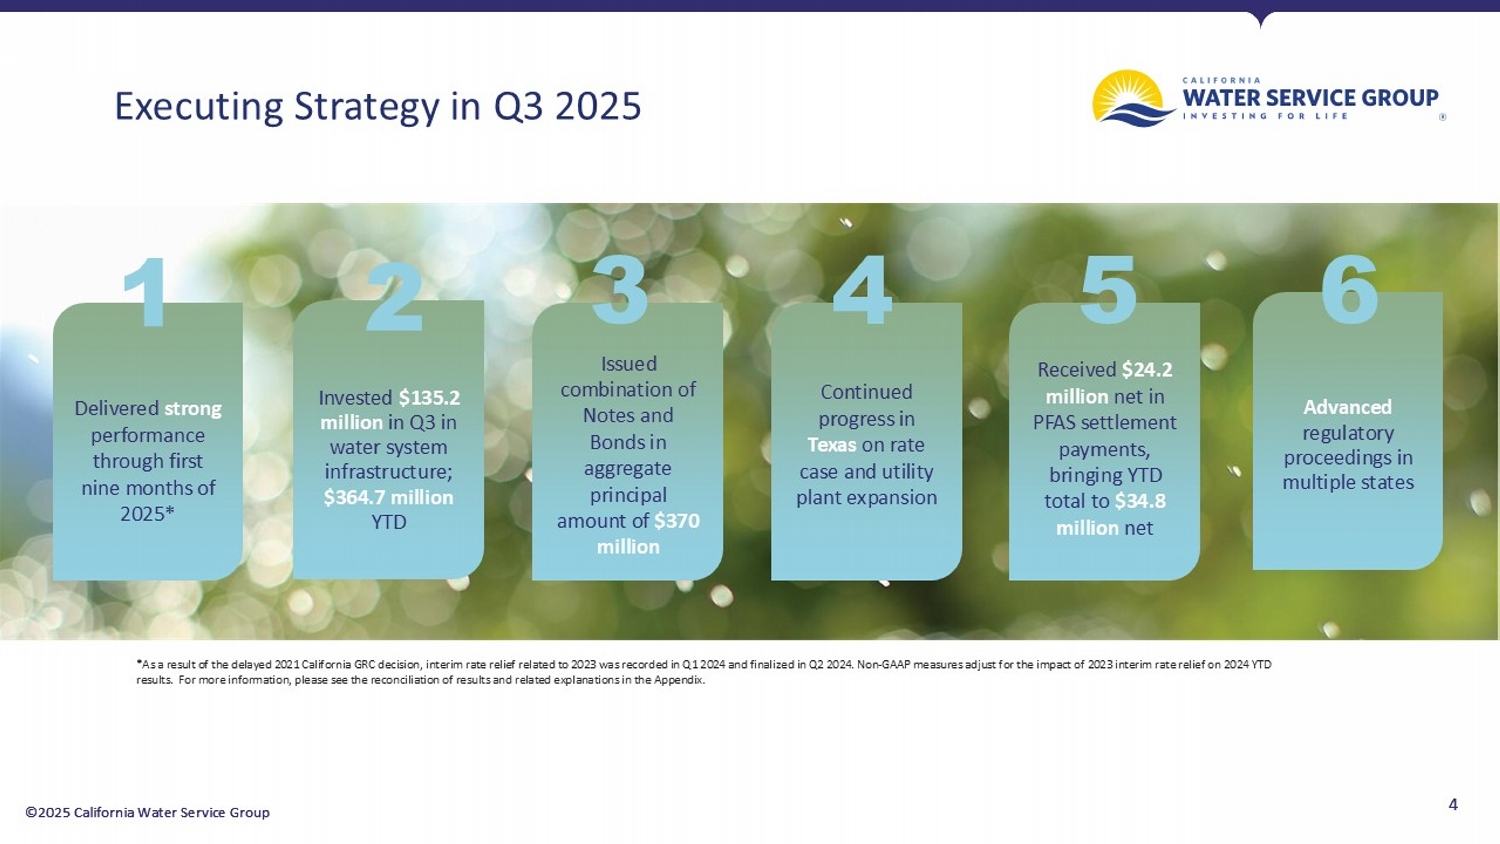
©2025 California Water Service Group 4 ©2025 California Water Service Group Executing Strategy in Q3 2025 4 Delivered strong performance through first nine months of 2025* Invested $135.2 million in Q3 in water system infrastructure; $364.7 million YTD Issued combination of Notes and Bonds in aggregate principal amount of $370 million 1 2 Advanced regulatory proceedings in multiple states Received $24.2 million net in PFAS settlement payments, bringing YTD total to $34.8 million net 5 Continued progress in Texas on rate case and utility plant expansion 6 *As a result of the delayed 2021 California GRC decision, interim rate relief related to 2023 was recorded in Q1 2024 and fin ali zed in Q2 2024. Non - GAAP measures adjust for the impact of 2023 interim rate relief on 2024 YTD results. For more information, please see the reconciliation of results and related explanations in the Appendix. 3 4
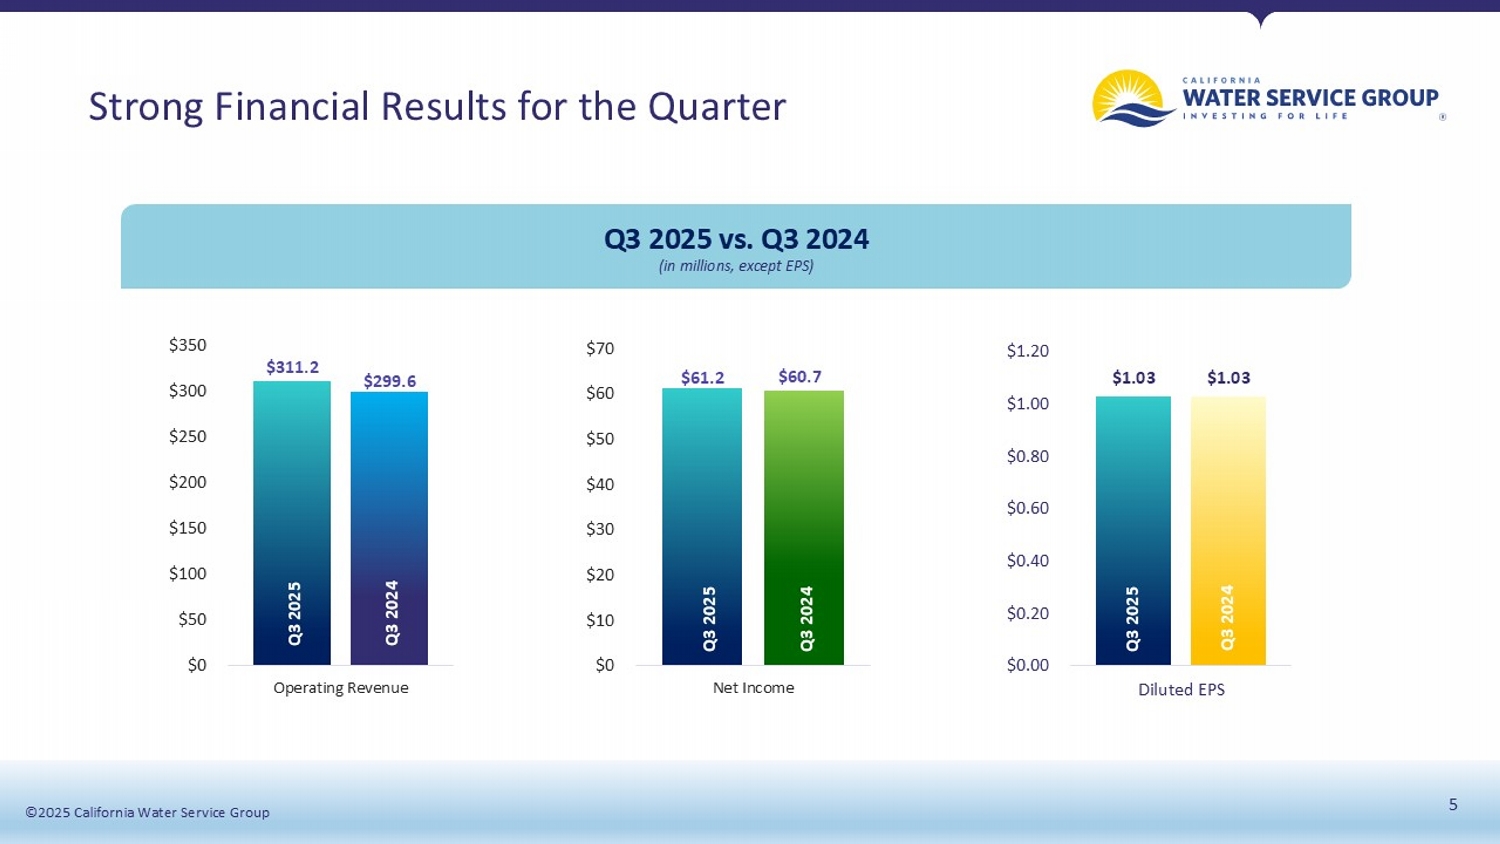
©2025 California Water Service Group 5 ©2025 California Water Service Group Strong Financial Results for the Quarter $311.2 $299.6 $0 $50 $100 $150 $200 $250 $300 $350 Operating Revenue $61.2 $60.7 $0 $10 $20 $30 $40 $50 $60 $70 Net Income $1.03 $1.03 $0.00 $0.20 $0.40 $0.60 $0.80 $1.00 $1.20 Diluted EPS Q3 2025 vs. Q3 2024 Q3 2024 Q3 2025 Q3 2024 Q3 2025 Q3 2024 Q3 2025 (in millions, except EPS)
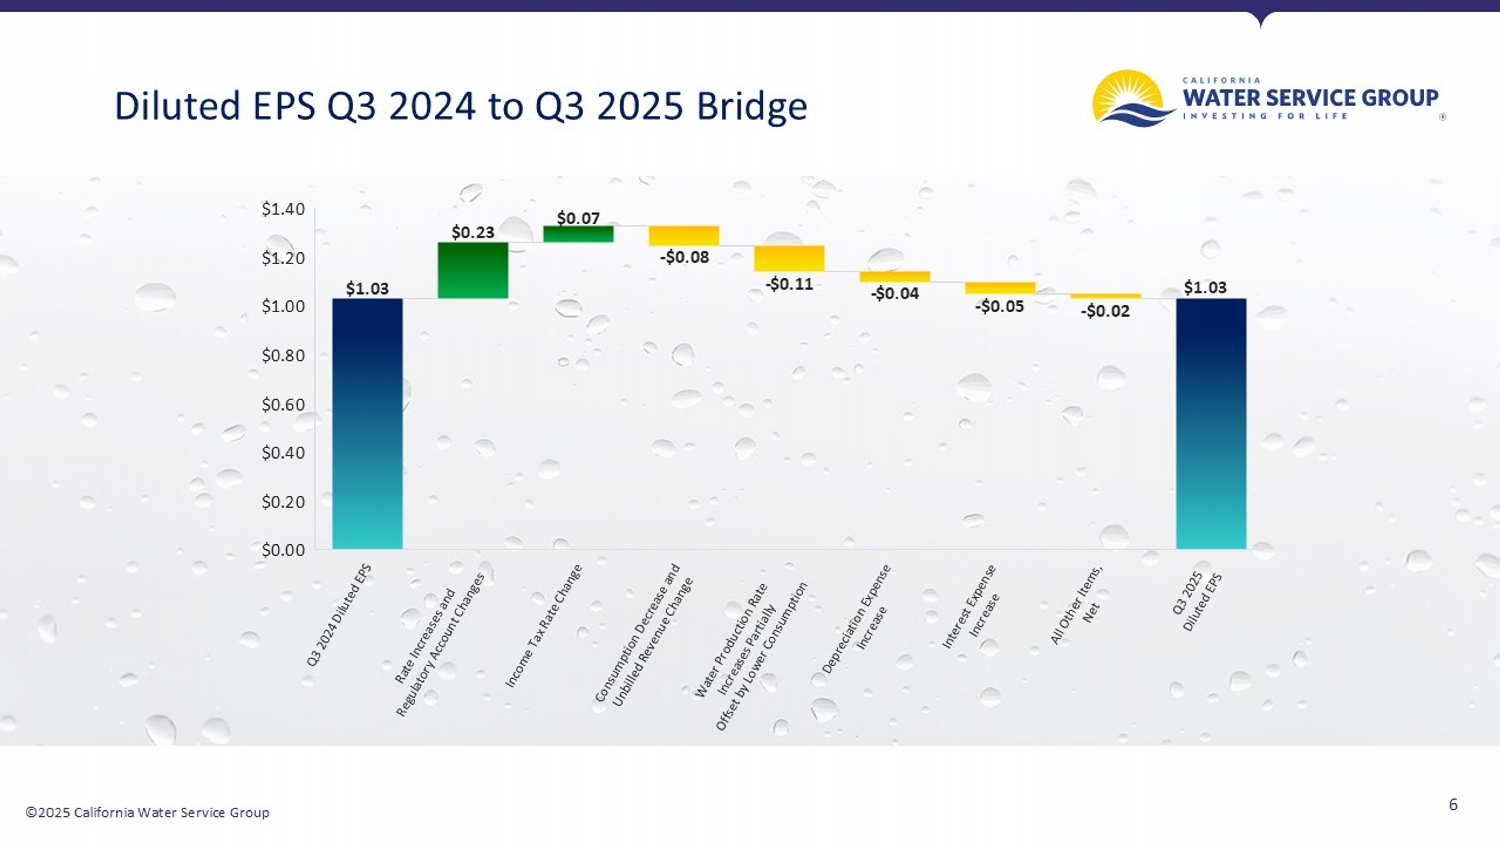
©2025 California Water Service Group 6 Diluted EPS Q3 2024 to Q3 2025 Bridge $1.03 $0.23 $0.07 - $0.08 - $0.11 - $0.04 - $0.05 - $0.02 $0.00 $0.20 $0.40 $0.60 $0.80 $1.00 $1.20 $1.40 $1.03
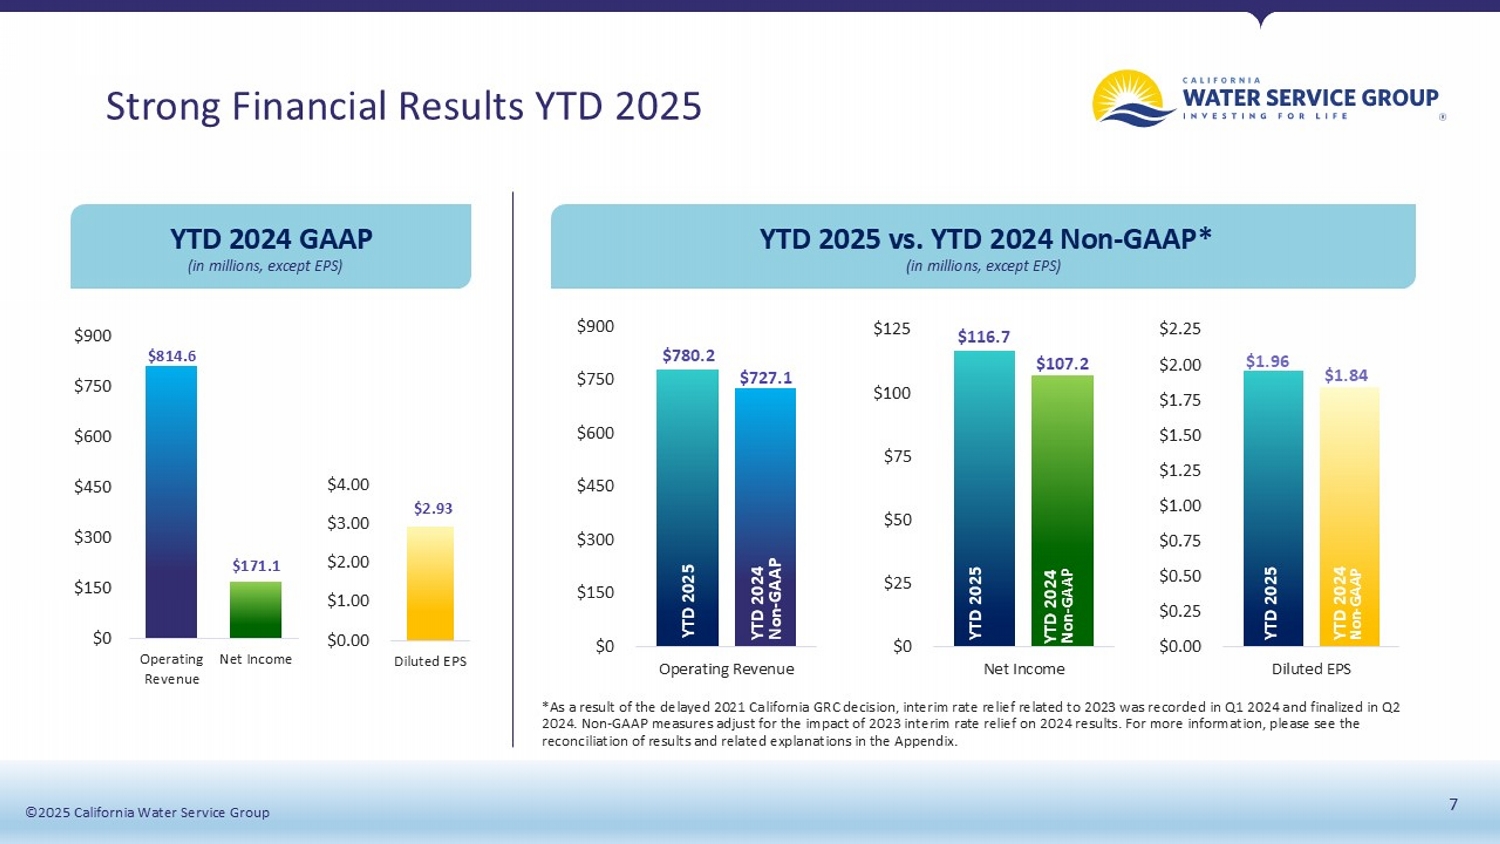
©2025 California Water Service Group 7 ©2025 California Water Service Group Strong Financial Results YTD 2025 (in millions, except EPS) $814.6 $171.1 $0 $150 $300 $450 $600 $750 $900 Operating Revenue Net Income $2.93 $0.00 $1.00 $2.00 $3.00 $4.00 Diluted EPS $780.2 $727.1 $0 $150 $300 $450 $600 $750 $900 Operating Revenue $116.7 $107.2 $0 $25 $50 $75 $100 $125 Net Income $0.00 $0.25 $0.50 $0.75 $1.00 $1.25 $1.50 $1.75 $2.00 $2.25 Diluted EPS $1.96 $1.84 YTD 2025 vs. YTD 2024 Non - GAAP* *As a result of the delayed 2021 California GRC decision, interim rate relief related to 2023 was recorded in Q1 2024 and finalized in Q2 2024. Non - GAAP measures adjust for the impact of 2023 interim rate relief on 2024 results. For more information, please see the reconciliation of results and related explanations in the Appendix. YTD 2024 Non - GAAP YTD 2025 YTD 2024 GAAP YTD 2024 Non - GAAP YTD 2025 YTD 2024 Non - GAAP YTD 2025 (in millions, except EPS)
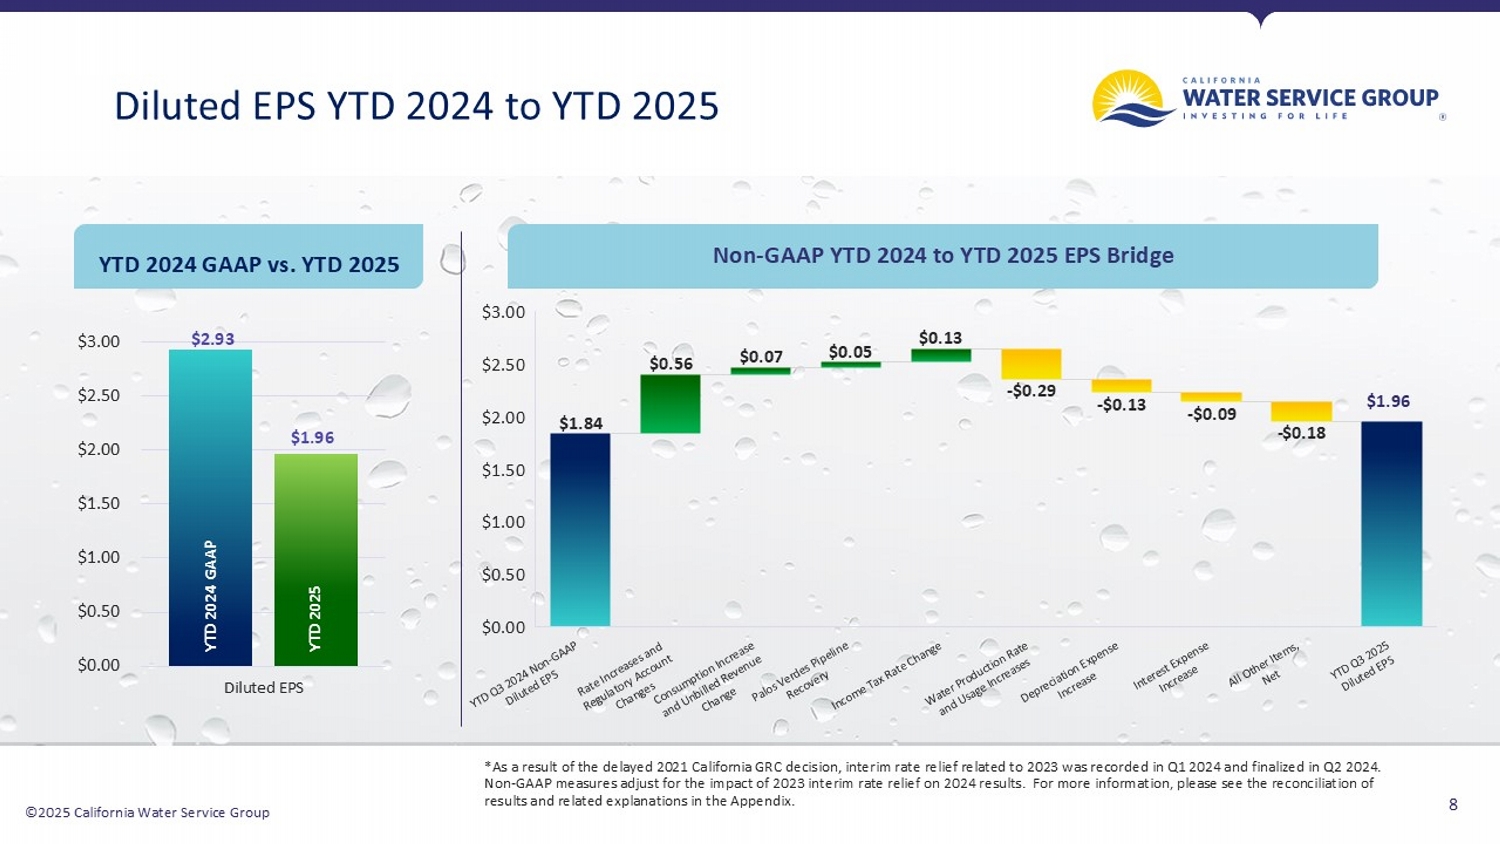
©2025 California Water Service Group 8 Diluted EPS YTD 2024 to YTD 2025 $2.93 $1.96 $0.00 $0.50 $1.00 $1.50 $2.00 $2.50 $3.00 Diluted EPS YTD 2024 GAAP vs. YTD 2025 Non - GAAP YTD 2024 to YTD 2025 EPS Bridge *As a result of the delayed 2021 California GRC decision, interim rate relief related to 2023 was recorded in Q1 2024 and finalized in Q2 2024. Non - GAAP measures adjust for the impact of 2023 interim rate relief on 2024 results. For more information, please see the recon ciliation of results and related explanations in the Appendix. YTD 2024 GAAP YTD 2025 $1.84 $0.56 $0.07 $0.05 $0.13 - $0.29 - $0.13 - $0.09 - $0.18 $0.00 $0.50 $1.00 $1.50 $2.00 $2.50 $3.00 $1.96
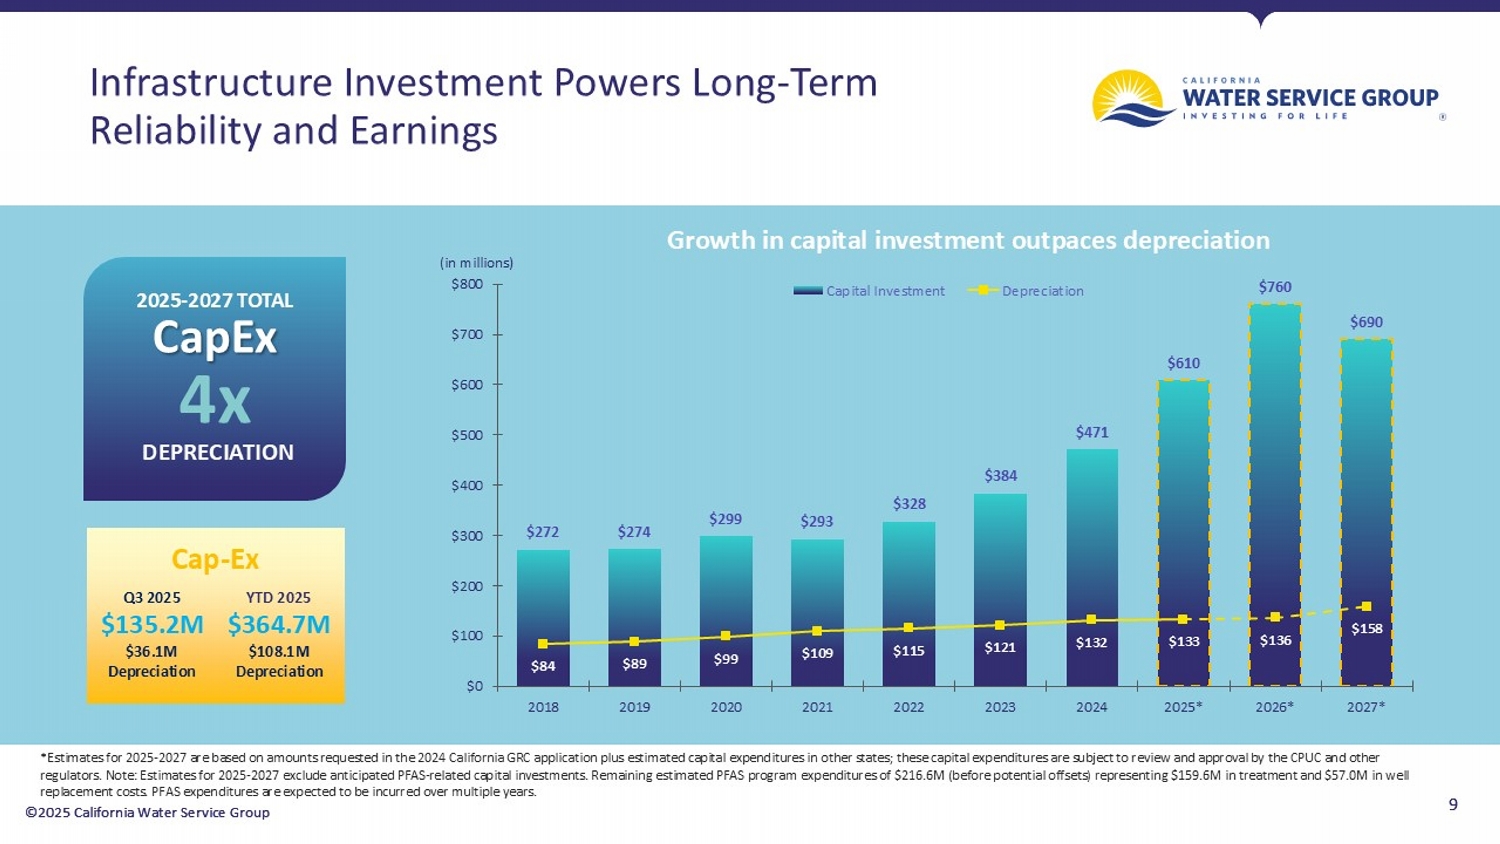
©2025 California Water Service Group 9 Infrastructure Investment Powers Long - Term Reliability and Earnings 9 ©2025 California Water Service Group $272 $274 $299 $293 $328 $384 $471 $610 $760 $690 $84 $89 $99 $109 $115 $121 $132 $133 $136 $158 $0 $100 $200 $300 $400 $500 $600 $700 $800 2018 2019 2020 2021 2022 2023 2024 2025* 2026* 2027* Capital Investment Depreciation 2025 - 2027 TOTAL CapEx 4x DEPRECIATION (in millions) *Estimates for 2025 - 2027 are based on amounts requested in the 2024 California GRC application plus estimated capital expenditures in other states; these capital expenditures are subject to review and approva l by the CPUC and other regulators. Note: Estimates for 2025 - 2027 exclude anticipated PFAS - related capital investments. Remaining estimated PFAS program expenditures of $216.6M (before potential offsets) representing $159.6M in treatment and $57.0M in well replacement costs. PFAS expenditures are expected to be incurred over multiple years. Growth in capital investment outpaces depreciation Q3 2025 $135.2M $36.1M Depreciation YTD 2025 $364.7M $108.1M Depreciation Cap - Ex
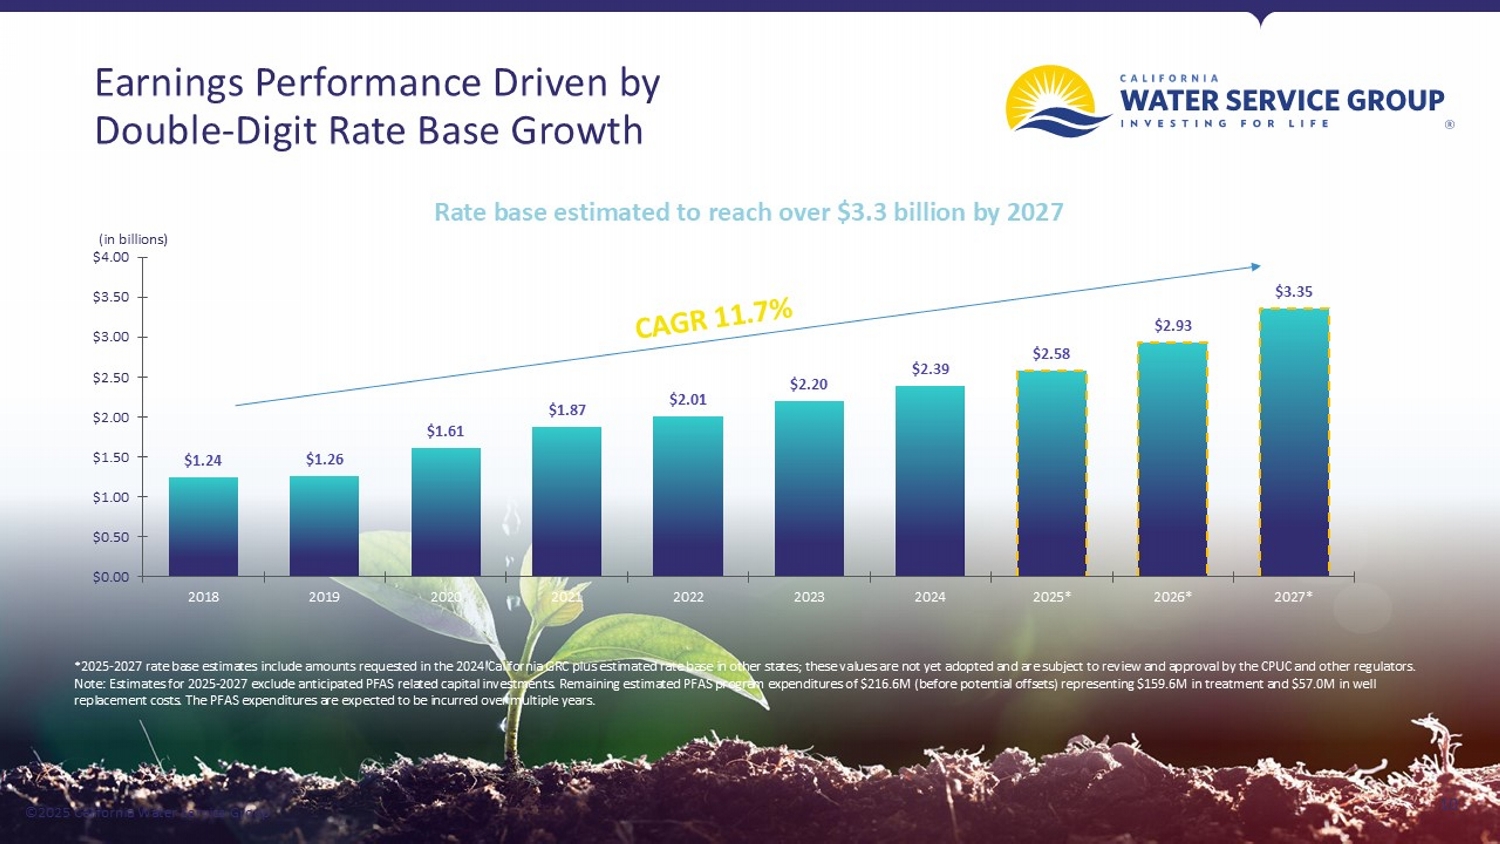
©2025 California Water Service Group Earnings Performance Driven by Double - Digit Rate Base Growth 10 ©2025 California Water Service Group $1.24 $1.26 $1.61 $1.87 $2.01 $2.20 $2.39 $2.58 $2.93 $3.35 $0.00 $0.50 $1.00 $1.50 $2.00 $2.50 $3.00 $3.50 $4.00 2018 2019 2020 2021 2022 2023 2024 2025* 2026* 2027* Rate base estimated to reach over $3.3 billion by 2027 (in billions) *2025 - 2027 rate base estimates include amounts requested in the 2024 California GRC plus estimated rate base in other states; these values are not yet adopted and are subject to review and approval by the CPUC a nd other regulators. Note: Estimates for 2025 - 2027 exclude anticipated PFAS related capital investments. Remaining estimated PFAS program expenditure s of $216.6M (before potential offsets) representing $159.6M in treatment and $57.0M in well replacement costs. The PFAS expenditures are expected to be incurred over multiple years.
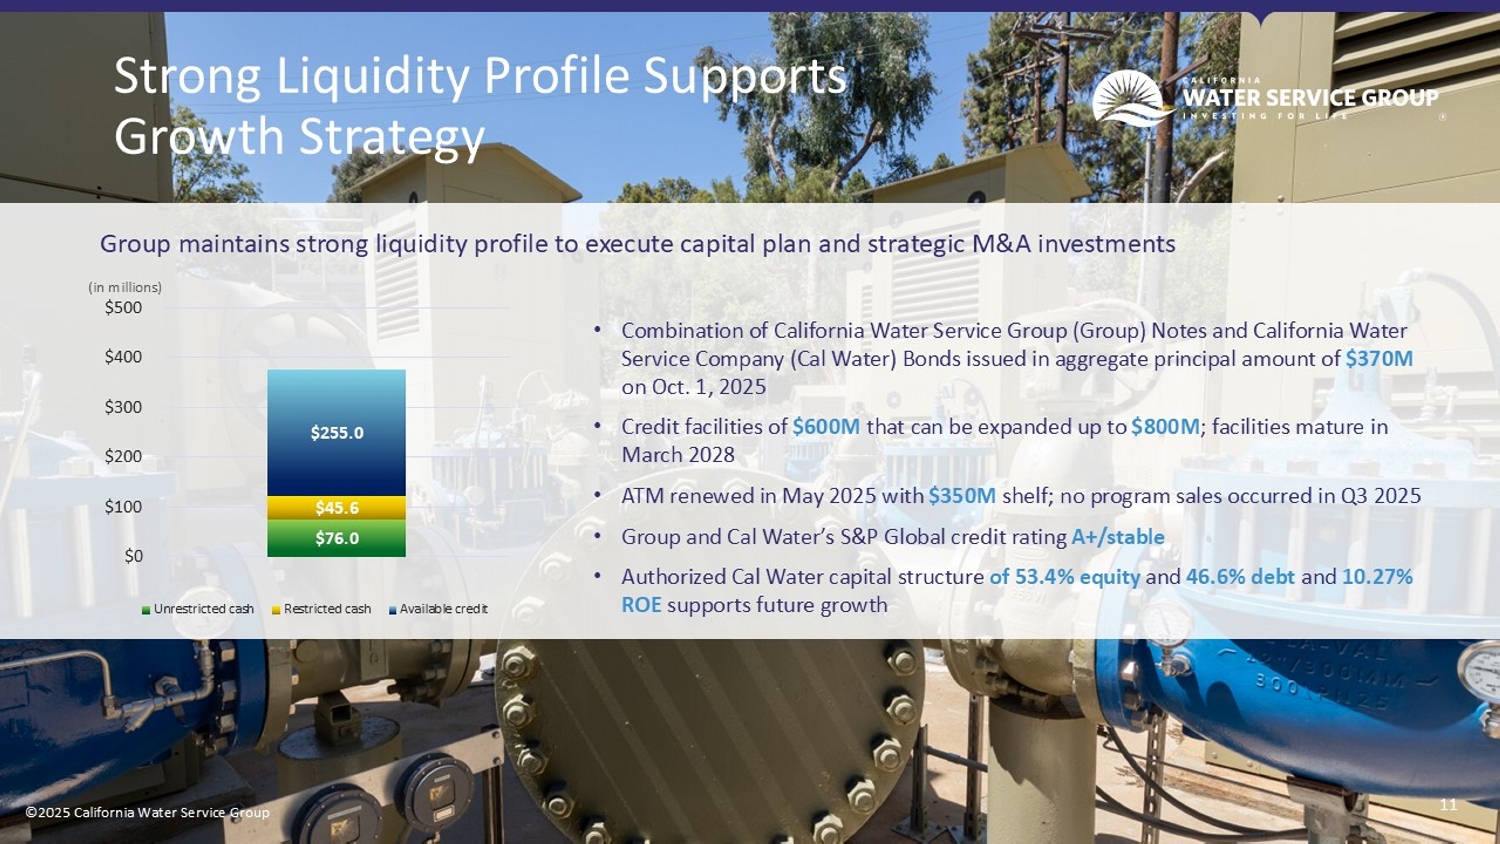
©2025 California Water Service Group 11 ©2025 California Water Service Group Strong Liquidity Profile Supports Growth Strategy Group maintains strong liquidity profile to execute capital plan and strategic M&A investments • Combination of California Water Service Group (Group) Notes and California Water Service Company (Cal Water) Bonds issued in aggregate principal amount of $370M on Oct. 1, 2025 • Credit facilities of $600M that can be expanded up to $ 800M ; facilities mature in March 2028 • ATM renewed in May 2025 with $350M shelf; no program sales occurred in Q3 2025 • Group and Cal Water’s S&P Global credit rating A+/stable • Authorized Cal Water capital structure of 53.4% equity and 46.6% debt and 10.27% ROE supports future growth (in millions) $76.0 $45.6 $255.0 $0 $100 $200 $300 $400 $500 Unrestricted cash Restricted cash Available credit
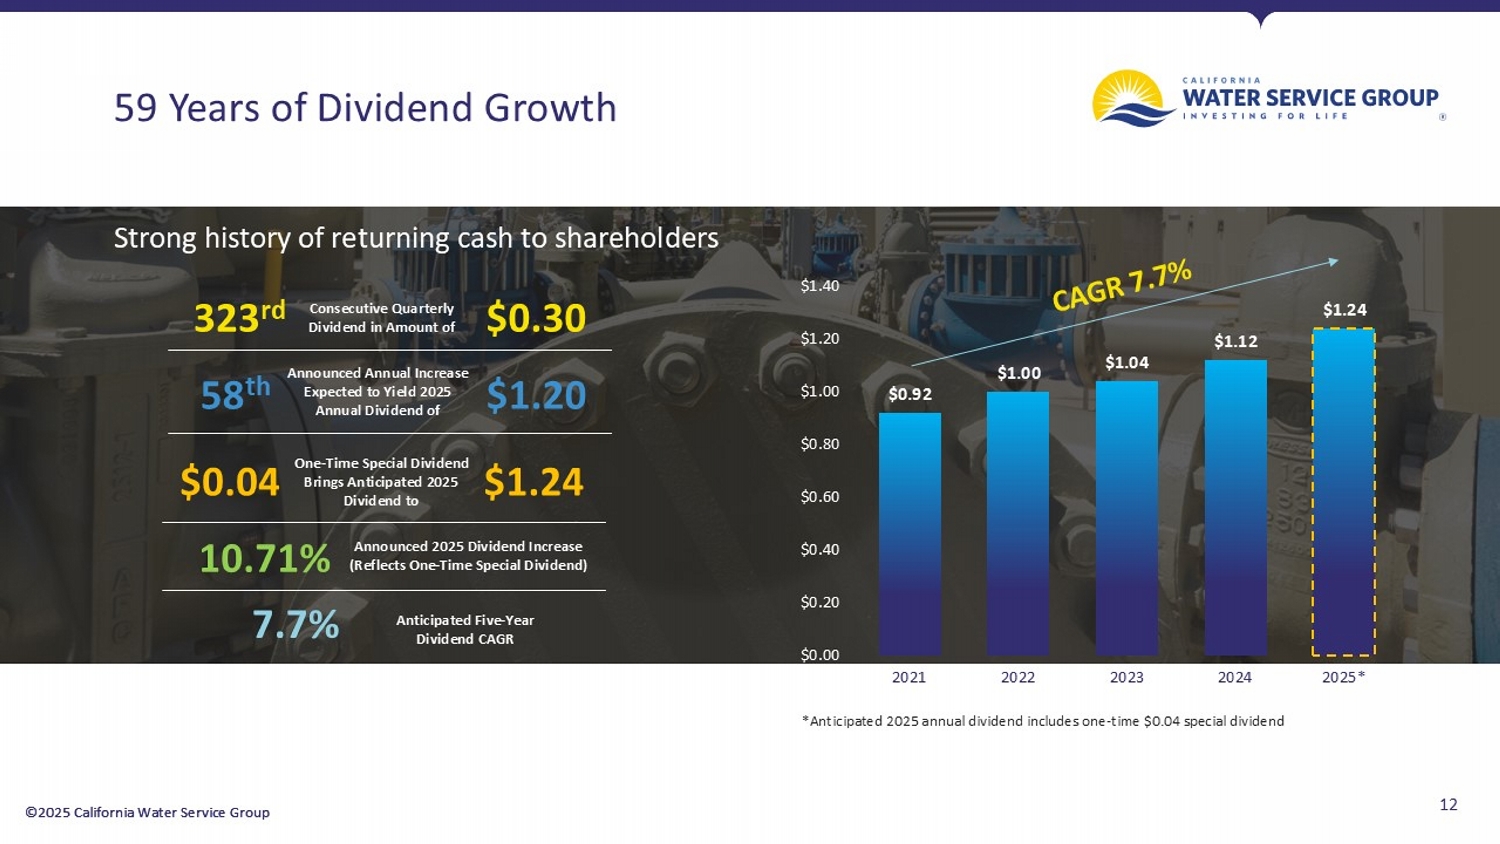
©2025 California Water Service Group 12 ©2025 California Water Service Group 59 Years of Dividend Growth Strong history of returning cash to shareholders $0.92 $1.00 $1.04 $1.12 $1.24 $0.00 $0.20 $0.40 $0.60 $0.80 $1.00 $1.20 $1.40 2021 2022 2023 2024 2025* *Anticipated 2025 annual dividend includes one - time $0.04 special dividend 323 rd $0.30 Consecutive Quarterly Dividend in Amount of 58 th $1.20 Announced Annual Increase Expected to Yield 2025 Annual Dividend of $0.04 $1.24 One - Time Special Dividend Brings Anticipated 2025 Dividend to 10.71% Announced 2025 Dividend Increase (Reflects One - Time Special Dividend) 7.7% Anticipated Five - Year Dividend CAGR
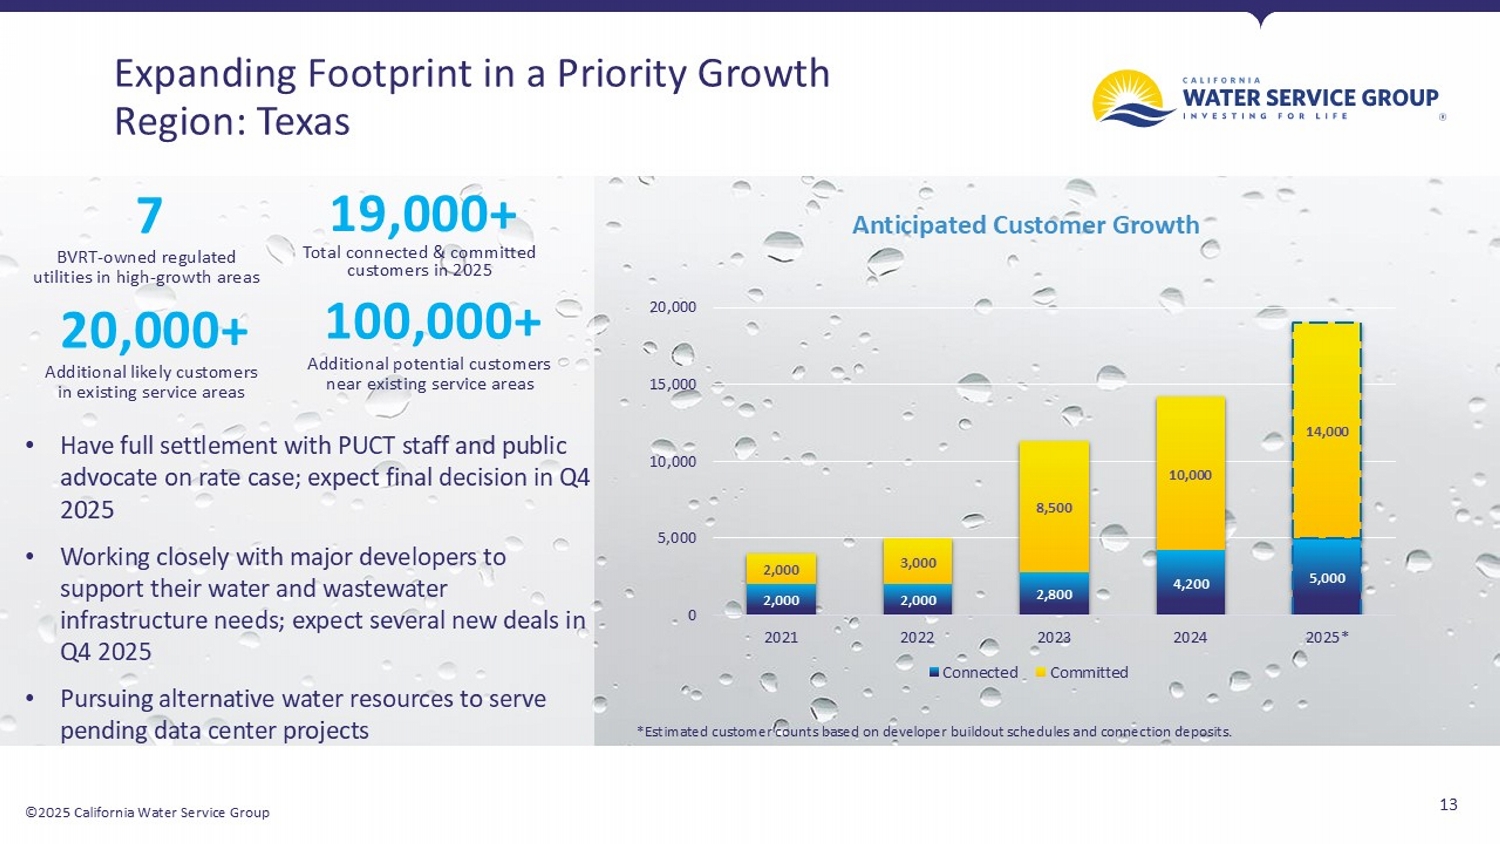
©2025 California Water Service Group 13 Expanding Footprint in a Priority Growth Region: Texas 19,000+ Total connected & committed customers in 2025 20,000+ Additional likely customers in existing service areas 100,000+ Additional potential customers near existing service areas 2,000 2,000 2,800 4,200 5,000 2,000 3,000 8,500 10,000 14,000 0 5,000 10,000 15,000 20,000 2021 2022 2023 2024 2025* Anticipated Customer Growth Connected Committed *Estimated customer counts based on developer buildout schedules and connection deposits. 7 BVRT - owned regulated utilities in high - growth areas • Have full settlement with PUCT staff and public advocate on rate case; expect final decision in Q4 2025 • Working closely with major developers to support their water and wastewater infrastructure needs; expect several new deals in Q4 2025 • Pursuing alternative water resources to serve pending data center projects
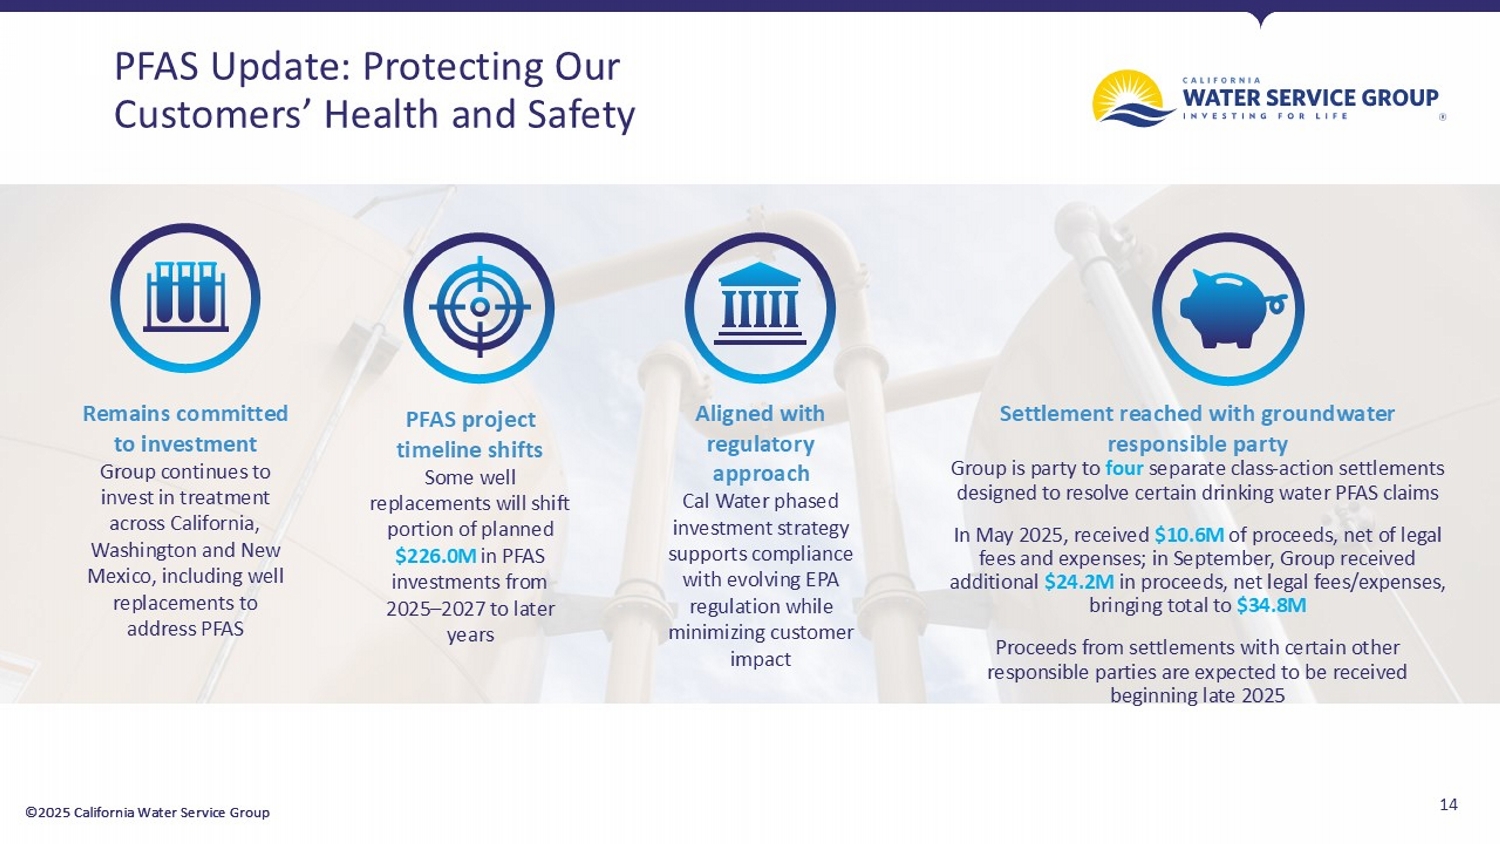
©2025 California Water Service Group 14 ©2025 California Water Service Group PFAS Update: Protecting Our Customers’ Health and Safety Remains committed to investment Group continues to invest in treatment across California, Washington and New Mexico, including well replacements to address PFAS PFAS project timeline shifts Some well replacements will shift portion of planned $ 226.0M in PFAS investments from 2025 – 2027 to later years Aligned with regulatory approach Cal Water phased investment strategy supports compliance with evolving EPA regulation while minimizing customer impact Settlement reached with groundwater responsible party Group is party to four separate class - action settlements designed to resolve certain drinking water PFAS claims In May 2025, received $10.6M of proceeds, net of legal fees and expenses; in September, Group received additional $24.2M in proceeds, net legal fees/expenses, bringing total to $34.8M Proceeds from settlements with certain other responsible parties are expected to be received beginning late 2025
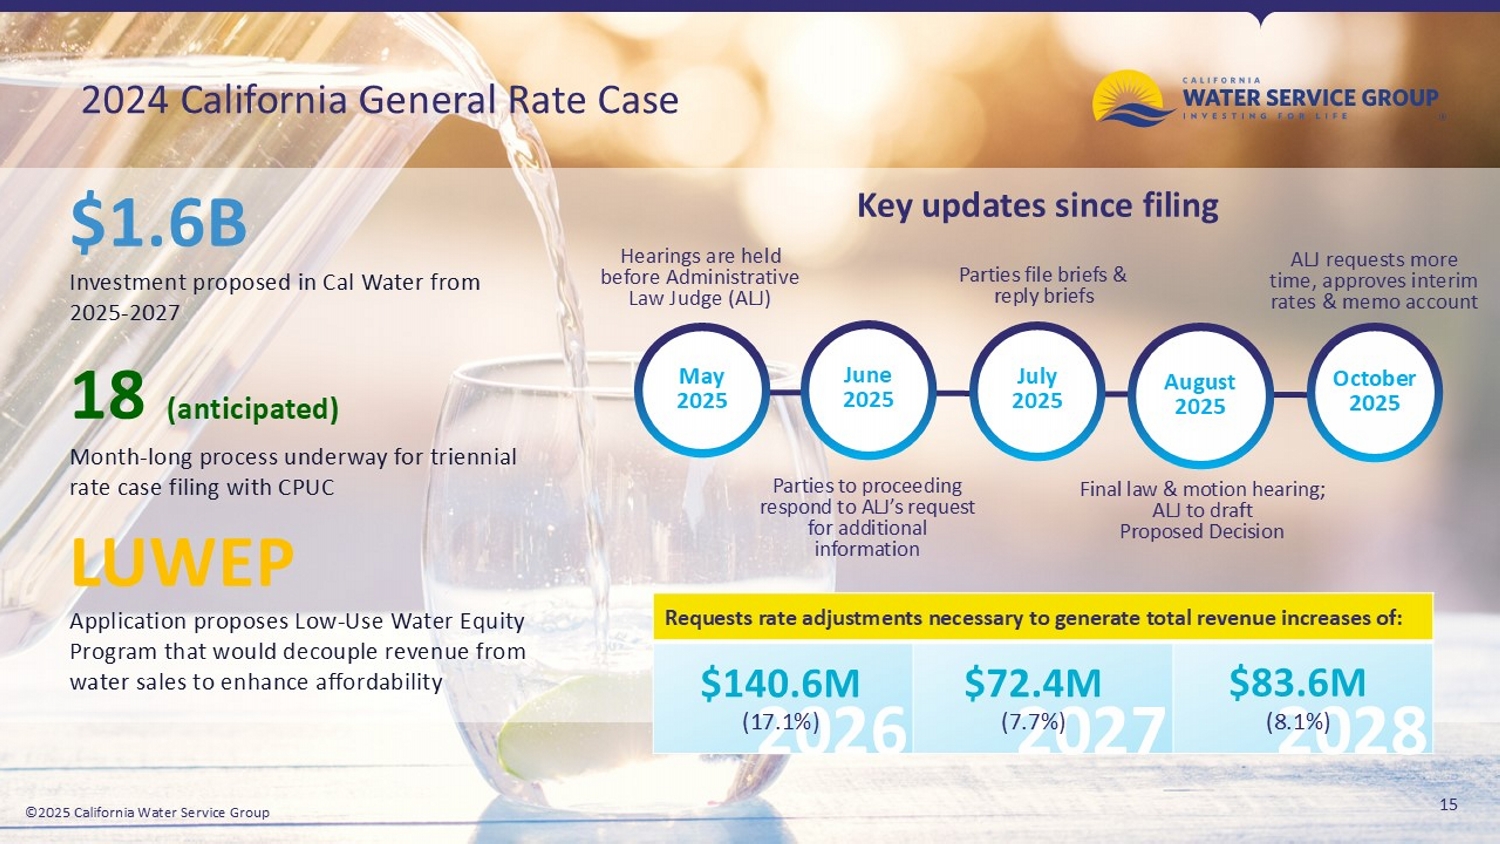
©2025 California Water Service Group 15 ©2025 California Water Service Group 2024 California General Rate Case $ 1.6B Investment proposed in Cal Water from 2025 - 2027 18 (anticipated) Month - long process underway for triennial rate case filing with CPUC LUWEP Application proposes Low - Use Water Equity Program that would decouple revenue from water sales to enhance affordability May 2025 June 2025 July 2025 August 2025 October 2025 Key updates since filing Hearings are held before Administrative Law Judge (ALJ) Parties to proceeding respond to ALJ’s request for additional information Parties file briefs & reply briefs Final law & motion hearing; ALJ to draft Proposed Decision Requests rate adjustments necessary to generate total revenue increases of: 2026 2027 2028 $ 140.6M (17.1%) $ 83.6M (8.1%) $ 72.4M (7.7%) ALJ requests more time, approves interim rates & memo account
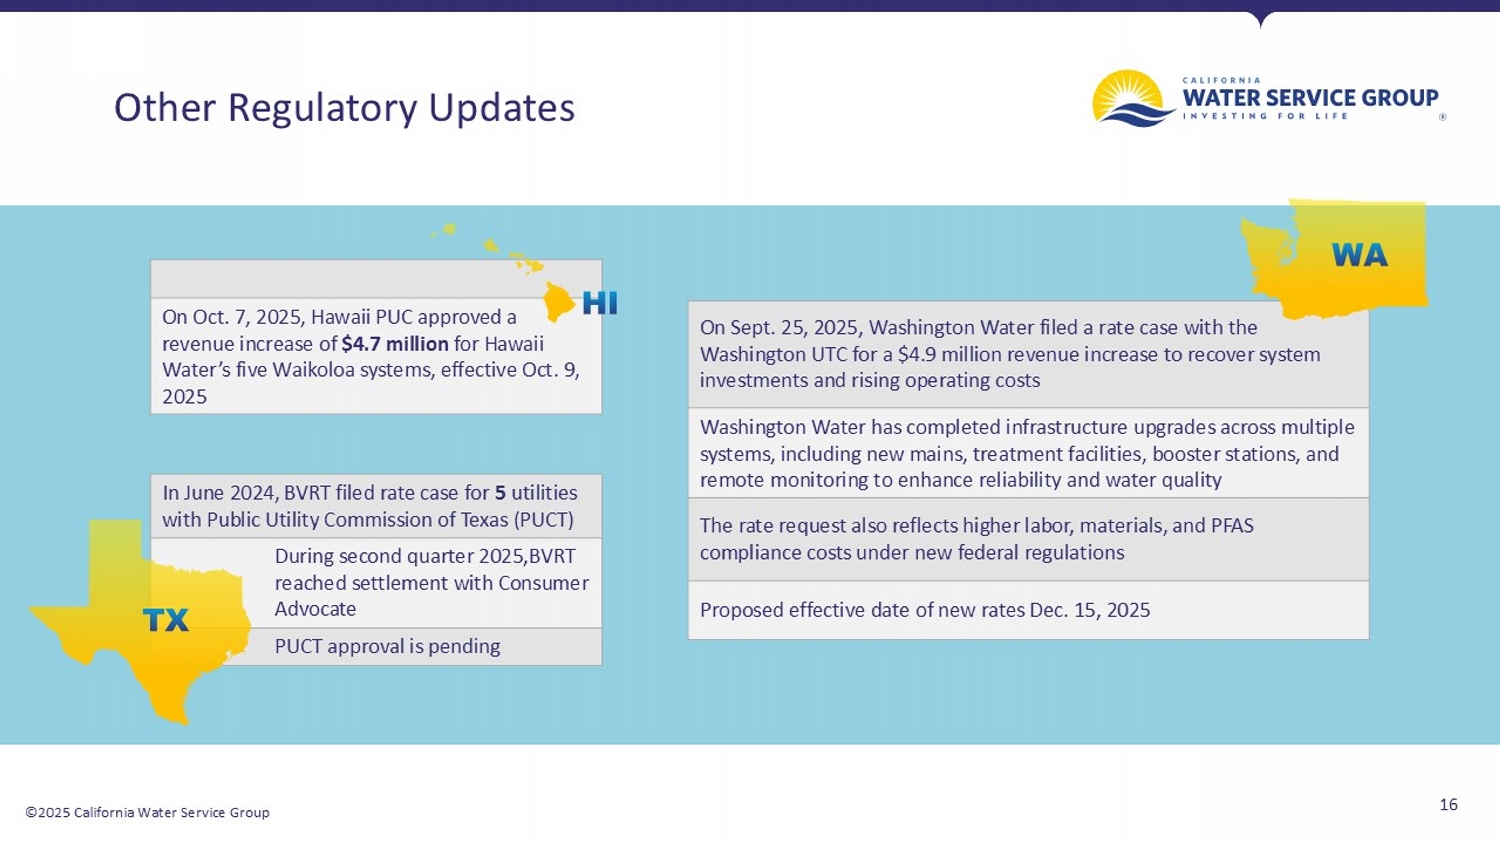
©2025 California Water Service Group 16 Other Regulatory Updates On Oct. 7, 2025, Hawaii PUC approved a revenue increase of $4.7 million for Hawaii Water’s five Waikoloa systems, effective Oct. 9, 2025 In June 2024, BVRT filed rate case for 5 utilities with Public Utility Commission of Texas ( PUCT ) During second quarter 2025,BVRT reached settlement with Consumer Advocate PUCT approval is pending On Sept. 25, 2025, Washington Water filed a rate case with the Washington UTC for a $4.9 million revenue increase to recover system investments and rising operating costs Washington Water has completed infrastructure upgrades across multiple systems, including new mains, treatment facilities, booster stations, and remote monitoring to enhance reliability and water quality The rate request also reflects higher labor, materials, and PFAS compliance costs under new federal regulations Proposed effective date of new rates Dec . 15, 2025
©2025 California Water Service Group 17 ©2025 California Water Service Group APPENDIX
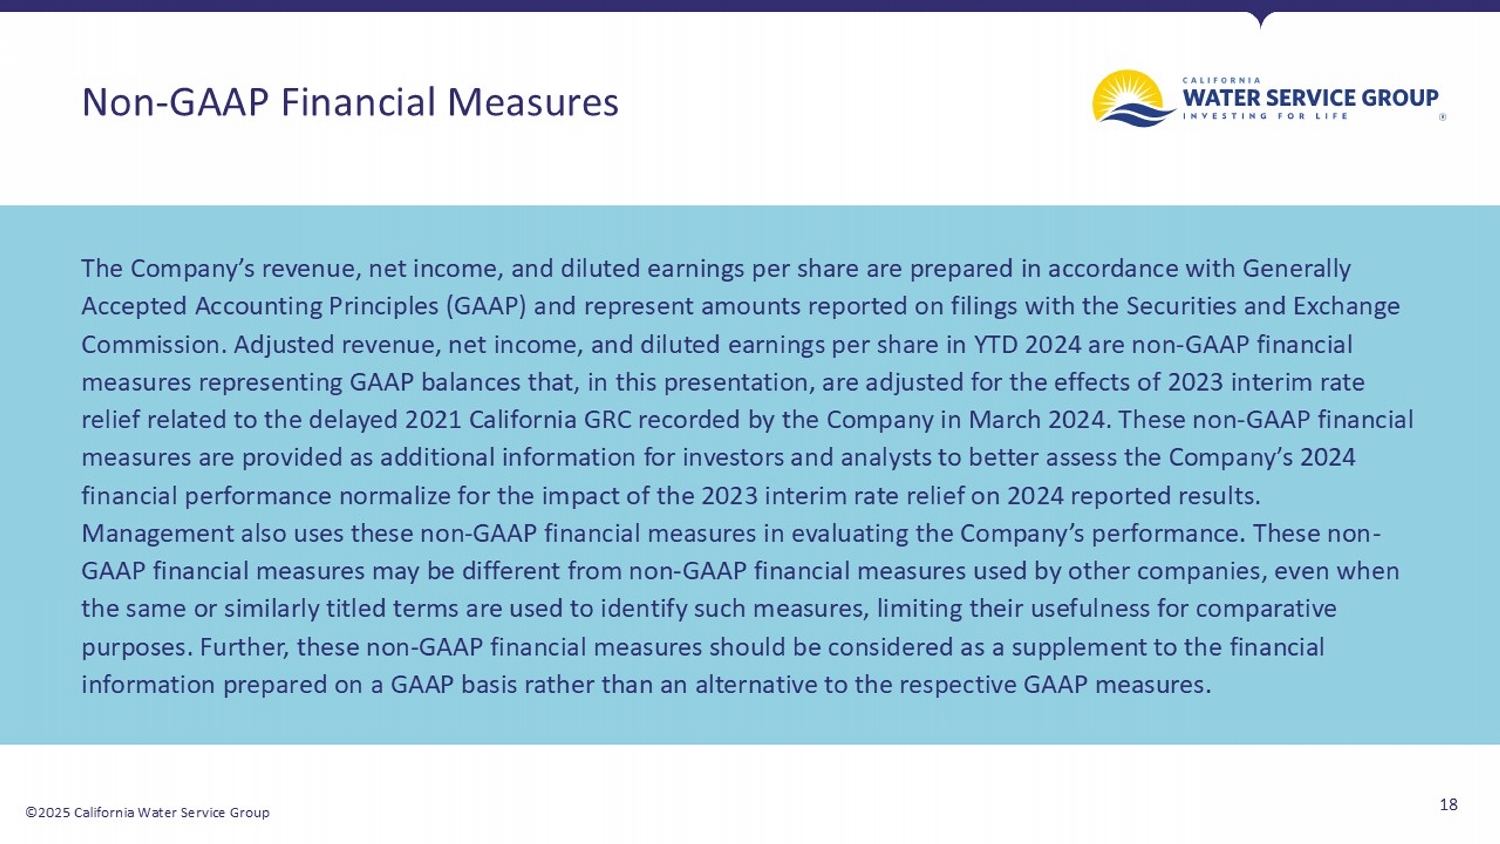
©2025 California Water Service Group 18 The Company’s revenue, net income, and diluted earnings per share are prepared in accordance with Generally Accepted Accounting Principles (GAAP) and represent amounts reported on filings with the Securities and Exchange Commission. Adjusted revenue, net income, and diluted earnings per share in YTD 2024 are non - GAAP financial measures representing GAAP balances that, in this presentation, are adjusted for the effects of 2023 interim rate relief related to the delayed 2021 California GRC recorded by the Company in March 2024. These non - GAAP financial measures are provided as additional information for investors and analysts to better assess the Company’s 2024 financial performance normalize for the impact of the 2023 interim rate relief on 2024 reported results. Management also uses these non - GAAP financial measures in evaluating the Company’s performance. These non - GAAP financial measures may be different from non - GAAP financial measures used by other companies, even when the same or similarly titled terms are used to identify such measures, limiting their usefulness for comparative purposes. Further, these non - GAAP financial measures should be considered as a supplement to the financial information prepared on a GAAP basis rather than an alternative to the respective GAAP measures. Non - GAAP Financial Measures
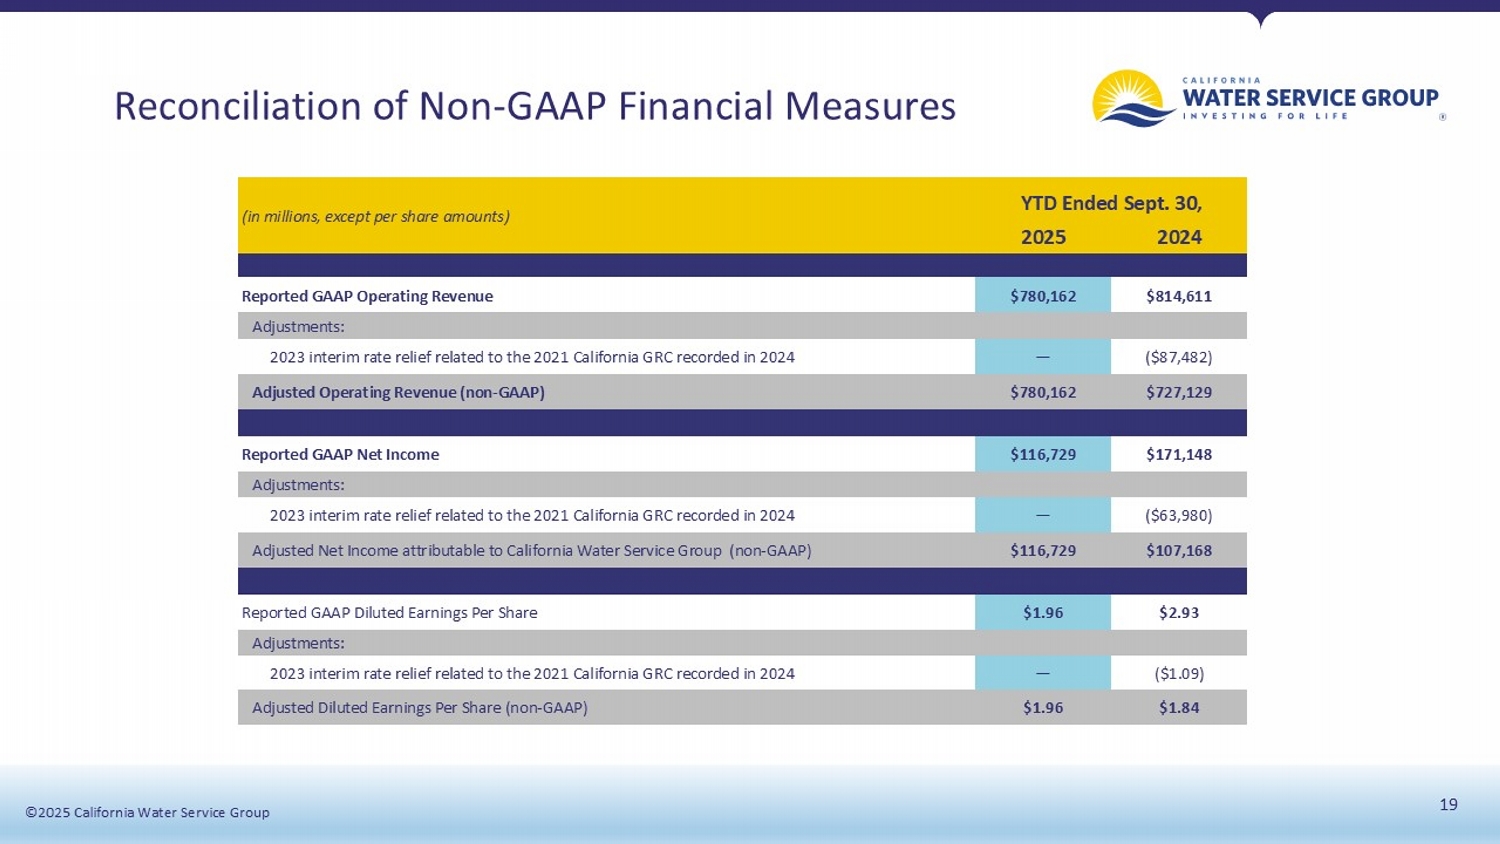
©2025 California Water Service Group ©2025 California Water Service Group 19 Reconciliation of Non - GAAP Financial Measures YTD Ended Sept. 30, (in millions, except per share amounts) 2024 2025 $814,611 $780,162 Reported GAAP Operating Revenue Adjustments: ($87,482) — 2023 interim rate relief related to the 2021 California GRC recorded in 2024 $727,129 $780,162 Adjusted Operating Revenue (non - GAAP) $171,148 $116,729 Reported GAAP Net Income Adjustments: ($63,980) — 2023 interim rate relief related to the 2021 California GRC recorded in 2024 $107,168 $116,729 Adjusted Net Income attributable to California Water Service Group (non - GAAP) $2.93 $1.96 Reported GAAP Diluted Earnings Per Share Adjustments: ($1.09) — 2023 interim rate relief related to the 2021 California GRC recorded in 2024 $1.84 $1.96 Adjusted Diluted Earnings Per Share (non - GAAP)