EXHIBIT 99.2
Published on July 31, 2025
Exhibit 99.2
Second Quarter 2025 Earnings Presentation July 31, 2025

2 Today’s Speakers Marty Kropelnicki Chairman & CEO James Lynch Sr. Vice President, CFO & Treasurer Shilen Patel Chief Business Development Officer and Vice President, TWSC, Inc.

3 This presentation contains forward - looking statements within the meaning established by the Private Securities Litigation Reform Act of 1995 (“PSLRA”). The forward - looking statements are intended to qualify under provisions of the federal securities laws for “safe harbor” treatment established by the PSLRA. Forward - looking statements in th is presentation are based on currently available information, expectations, estimates, assumptions and projections, and our management’s beliefs, assumptions, judgments and expectations about us, the water utilit y i ndustry and general economic conditions. These statements are not statements of historical fact. When used in our documents, statements that are not historical in nature, including words like will, would, exp ects, intends, plans, believes, may, could, estimates, assumes, anticipates, projects, progress, predicts, hopes, targets, forecasts, should, seeks or variations of these words or similar expressions are intended to identify forward - looking statements. Examples of forward - looking statements in this presentation include, but are not limited to, statements describing expectations regarding financial performance, operating p lan s, capital investments and expenditures, depreciation, expectations regarding California Water Service Group’s (Group or Company) plans and proposals pursuant to and progress of the California Water Service Company ’s (Cal Water) 2024 General Rate Case, the anticipated transfer of ownership pursuant to and expected benefits resulting from the Silverwood agreement, PFAS - related investments and receipt of PFAS settleme nt proceeds, rate base growth, customer growth potential, compound annual growth rate, sufficiency of cash and liquidity to support capital investment and growth, and annual dividend yield. Forward - look ing statements are not guarantees of future performance. They are based on numerous assumptions that we believe are reasonable, but they are open to a wide range of uncertainties and business risks. Consequent ly, actual results or outcomes may vary materially from what is contained in a forward - looking statement. Factors that may cause actual results or outcomes to be different than those expected or anticipated inclu de, but are not limited to: the outcome and timeliness of regulatory commissions’ actions concerning rate relief and other matters, including with respect to the 2024 GRC; the impact of opposition to rate increases; ou r ability to recover costs; Federal governmental and state regulatory commissions’ decisions, including decisions on proper disposition of property; changes in state regulatory commissions’ policies and proce dur es, such as the CPUC’s decision in 2020 to preclude companies from proposing fully decoupled WRAMs, which impacted the 2021 GRC Filing; changes in California State Water Resources Control Board water quality sta ndards; changes in environmental compliance and water quality requirements, such as the United States Environmental Protection Agency’s (EPA) finalization of a National Primary Drinking Water Regulatio n e stablishing legally enforceable maximum contaminant levels (MCL) for six PFAS in drinking water in 2024; the impact of weather, climate change, natural disasters, including wildfires and landslides, and act ual or threatened public health emergencies, including disease outbreaks, on our operations, water quality, water availability, water sales and operating results and the adequacy of our emergency preparedness; electric po wer interruptions, especially as a result of public safety power shutoff programs; availability of water supplies; our ability to invest or apply the proceeds from the issuance of common stock in an accretive ma nner; consequences of eminent domain actions relating to our water systems; our ability to renew leases to operate water systems owned by others on beneficial terms; increased risk of inverse condemnation losses a s a result of the impact of weather, climate change, and natural disasters, including wildfires and landslides; housing and customer growth; issues with the implementation, maintenance or security of our informa tio n technology systems; civil disturbances or terrorist threats or acts; the adequacy of our efforts to mitigate physical and cyber security risks and threats; the ability of our enterprise risk management processe s t o identify or address risks adequately; labor relations matters as we negotiate with the unions; changes in customer water use patterns and the effects of conservation, including as a result of drought conditions; our ability to complete, in a timely manner or at all, successfully integrate and achieve anticipated benefits from announced acquisitions; restrictive covenants in or changes to the credit ratings on our current or fu ture debt that could increase our financing costs or affect our ability to borrow, make payments on debt or pay dividends; risks associated with expanding our business and operations geographically; the impact of sta gnating or worsening business and economic conditions, including inflationary pressures, general economic slowdown or a recession, changes in tariff policy and uncertainty regarding tariffs and other retal iatory trade measures, the interest rate environment, changes in monetary policy, adverse capital markets activity or macroeconomic conditions as a result of geopolitical conflicts; the impact of market cond iti ons and volatility on unrealized gains or losses on our non - qualified benefit plan investments and our operating results; the impact of weather and timing of meter reads on our accrued unbilled revenue; the i mpa ct of evolving legal and regulatory requirements, including emerging environmental, social and governance requirements; the impact of the evolving U.S. political environment that has led to, in some cases, leg al challenges and uncertainty around the funding, functioning and policy priorities of U.S. federal regulatory agencies and the status of current and future regulations; and other risks and unforeseen events described in our Securities and Exchange Commission (“SEC”) filings. In light of these risks, uncertainties and assumptions, investors are cautioned not to place undue reliance on forward - looking statements, which speak on ly as of the date of this presentation. When considering forward - looking statements, you should keep in mind the cautionary statements included in this paragraph, as well as the Annual Report on Form 10 - K, Quarter ly 10 - Q, and other reports filed from time - to - time with the SEC. We are not under any obligation, and we expressly disclaim any obligation to update or alter any forward - looking statements, whether as a result of n ew information, future events or otherwise. A credit rating is not a recommendation to buy, sell, or hold any securities, and may be changed at any time by the applicable ratings agency and should be evaluated in dep endently of any other information. Forward - Looking Statements and Other Important Information
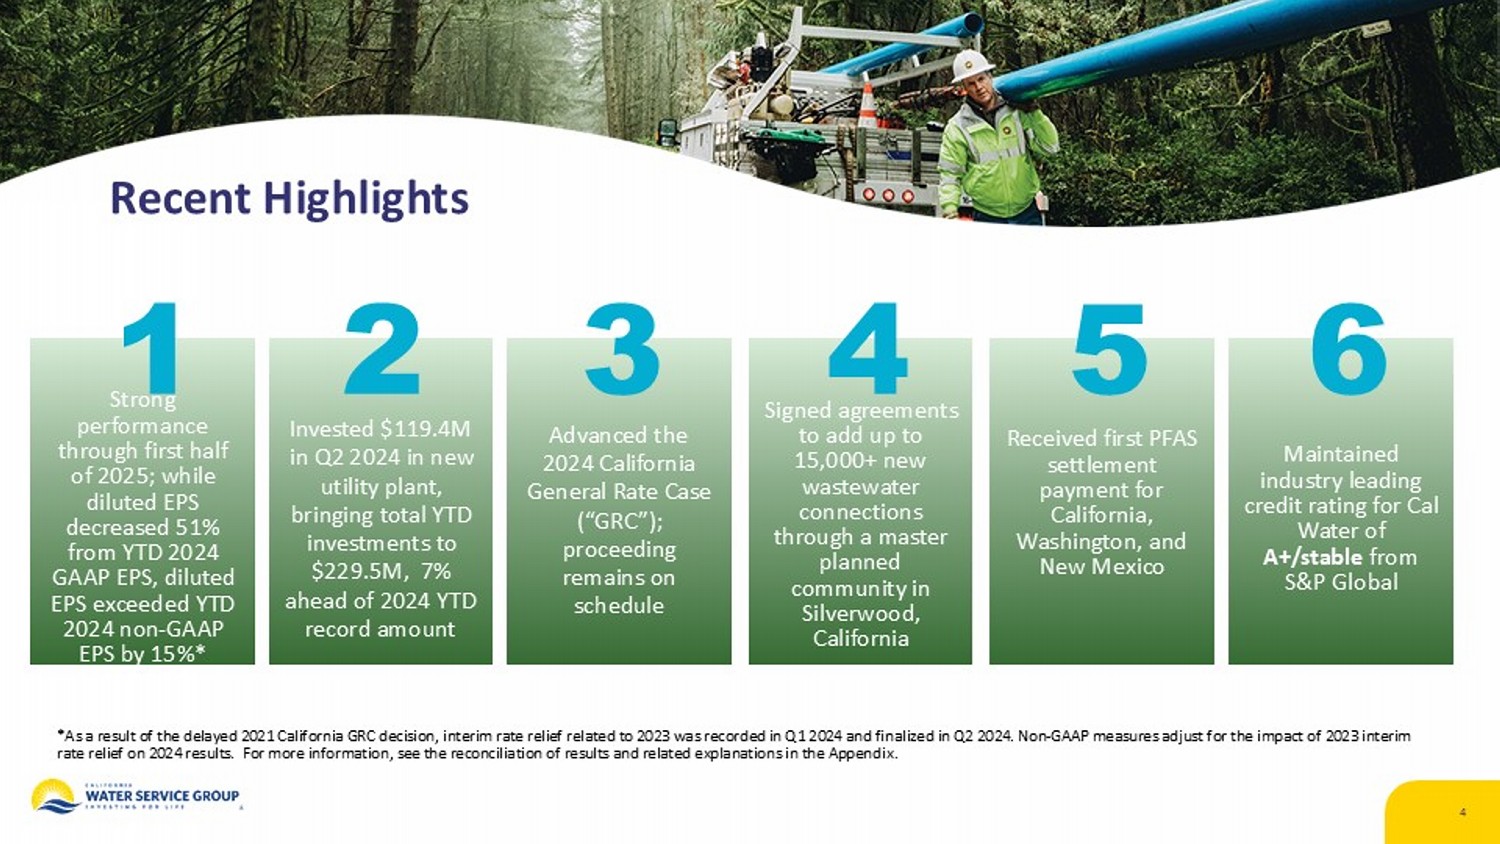
4 Recent Highlights *As a result of the delayed 2021 California GRC decision, interim rate relief related to 2023 was recorded in Q1 2024 and fin ali zed in Q2 2024. Non - GAAP measures adjust for the impact of 2023 interim rate relief on 2024 results. For more information, see the reconciliation of results and related explanations in the Appendi x. Strong performance through first half of 2025; while diluted EPS decreased 51% from YTD 2024 GAAP EPS, diluted EPS exceeded YTD 2024 non - GAAP EPS by 15%* Invested $119.4M in Q2 2024 in new utility plant, bringing total YTD investments to $229.5M, 7% ahead of 2024 YTD record amount Signed agreements to add up to 15,000+ new wastewater connections through a master planned community in Silverwood, California 1 2 3 4 Advanced the 2024 California General Rate Case (“GRC”); proceeding remains on schedule Received first PFAS settlement payment for California, Washington, and New Mexico 5 Maintained industry leading credit rating for Cal Water of A+/stable from S&P Global 6
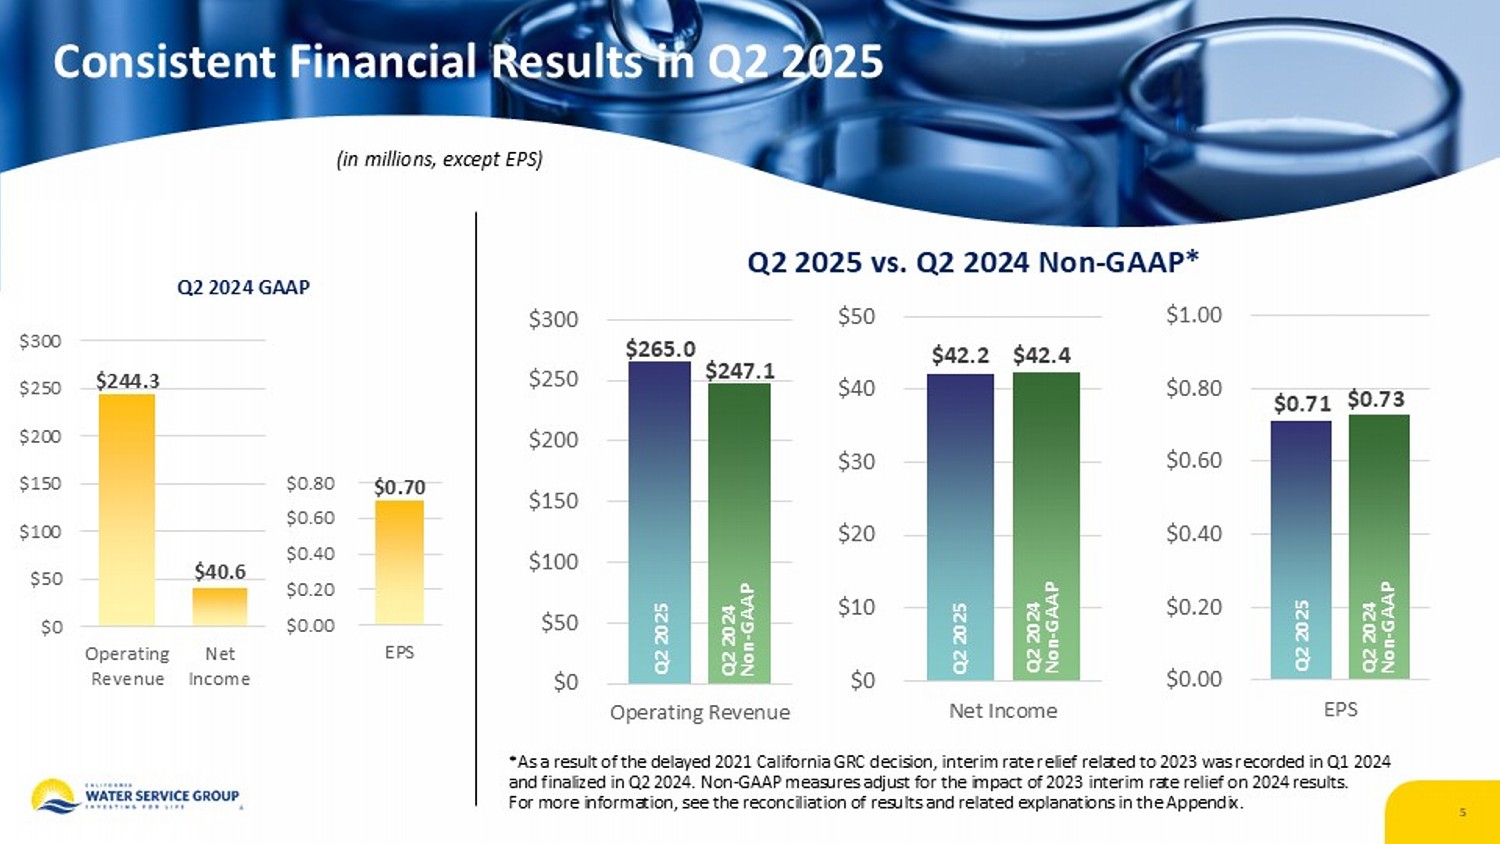
Consistent Financial Results in Q2 2025 $244.3 $40.6 $0 $50 $100 $150 $200 $250 $300 Operating Revenue Net Income $0.70 $0.00 $0.20 $0.40 $0.60 $0.80 EPS $265.0 $247.1 $0 $50 $100 $150 $200 $250 $300 Operating Revenue (in millions, except EPS) $42.2 $42.4 $0 $10 $20 $30 $40 $50 Net Income $0.71 $0.73 $0.00 $0.20 $0.40 $0.60 $0.80 $1.00 EPS Q2 2025 vs. Q2 2024 Non - GAAP* *As a result of the delayed 2021 California GRC decision, interim rate relief related to 2023 was recorded in Q1 2024 and finalized in Q2 2024. Non - GAAP measures adjust for the impact of 2023 interim rate relief on 2024 results. For more information, see the reconciliation of results and related explanations in the Appendix. Q2 2024 Non - GAAP Q2 2025 Q2 2024 GAAP Q2 2024 Non - GAAP Q2 2025 Q2 2024 Non - GAAP Q2 2025 5
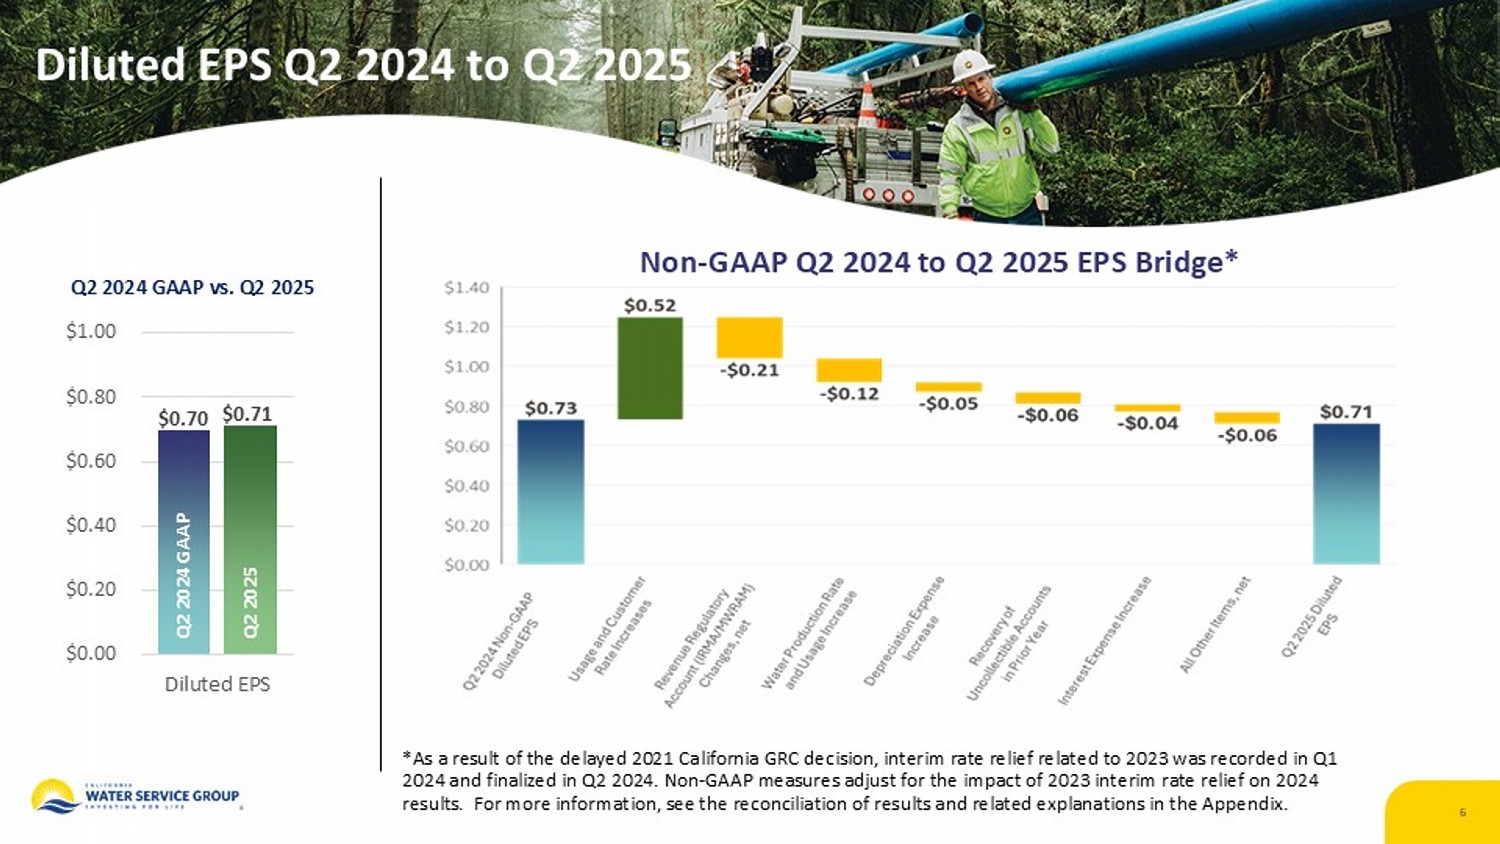
Diluted EPS Q2 2024 to Q2 2025 6 $0.70 $0.71 $0.00 $0.20 $0.40 $0.60 $0.80 $1.00 Diluted EPS Q2 2024 GAAP vs. Q2 2025 Q2 2024 GAAP Q2 2025 Non - GAAP Q 2 2024 to Q2 2025 EPS Bridge *As a result of the delayed 2021 California GRC decision, interim rate relief related to 2023 was recorded in Q1 2024 and finalized in Q2 2024. Non - GAAP measures adjust for the impact of 2023 interim rate relief on 2024 results. For more information, see the reconciliation of results and related explanations in the Appendix.
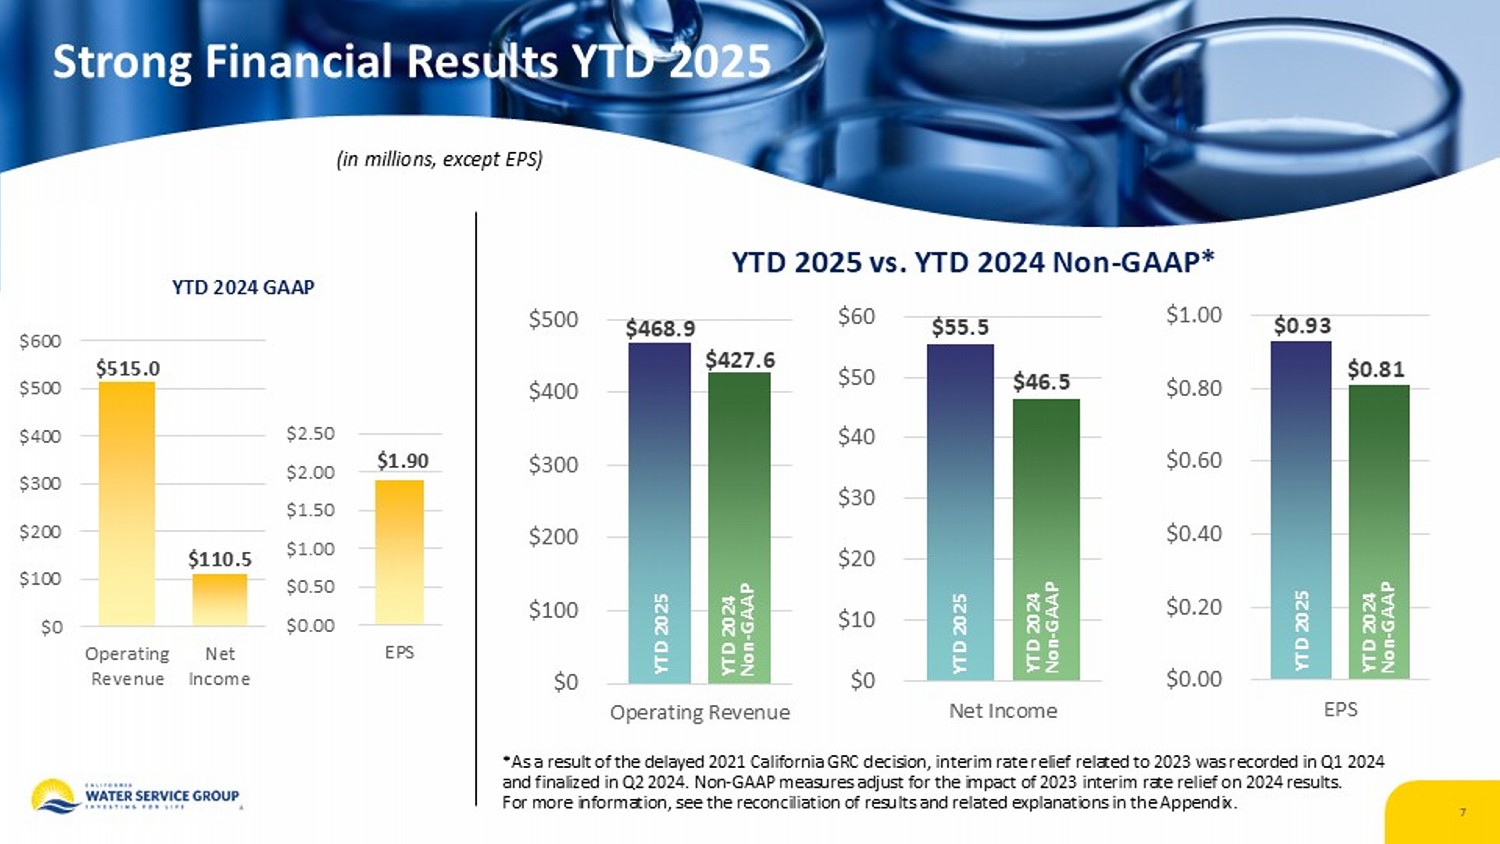
Strong Financial Results YTD 2025 $515.0 $110.5 $0 $100 $200 $300 $400 $500 $600 Operating Revenue Net Income $1.90 $0.00 $0.50 $1.00 $1.50 $2.00 $2.50 EPS $468.9 $427.6 $0 $100 $200 $300 $400 $500 Operating Revenue (in millions, except EPS) $55.5 $46.5 $0 $10 $20 $30 $40 $50 $60 Net Income $0.93 $0.81 $0.00 $0.20 $0.40 $0.60 $0.80 $1.00 EPS YTD 2025 vs. YTD 2024 Non - GAAP* *As a result of the delayed 2021 California GRC decision, interim rate relief related to 2023 was recorded in Q1 2024 and finalized in Q2 2024. Non - GAAP measures adjust for the impact of 2023 interim rate relief on 2024 results. For more information, see the reconciliation of results and related explanations in the Appendix. YTD 2024 Non - GAAP YTD 2025 YTD 2024 GAAP YTD 2024 Non - GAAP YTD 2025 YTD 2024 Non - GAAP YTD 2025 7
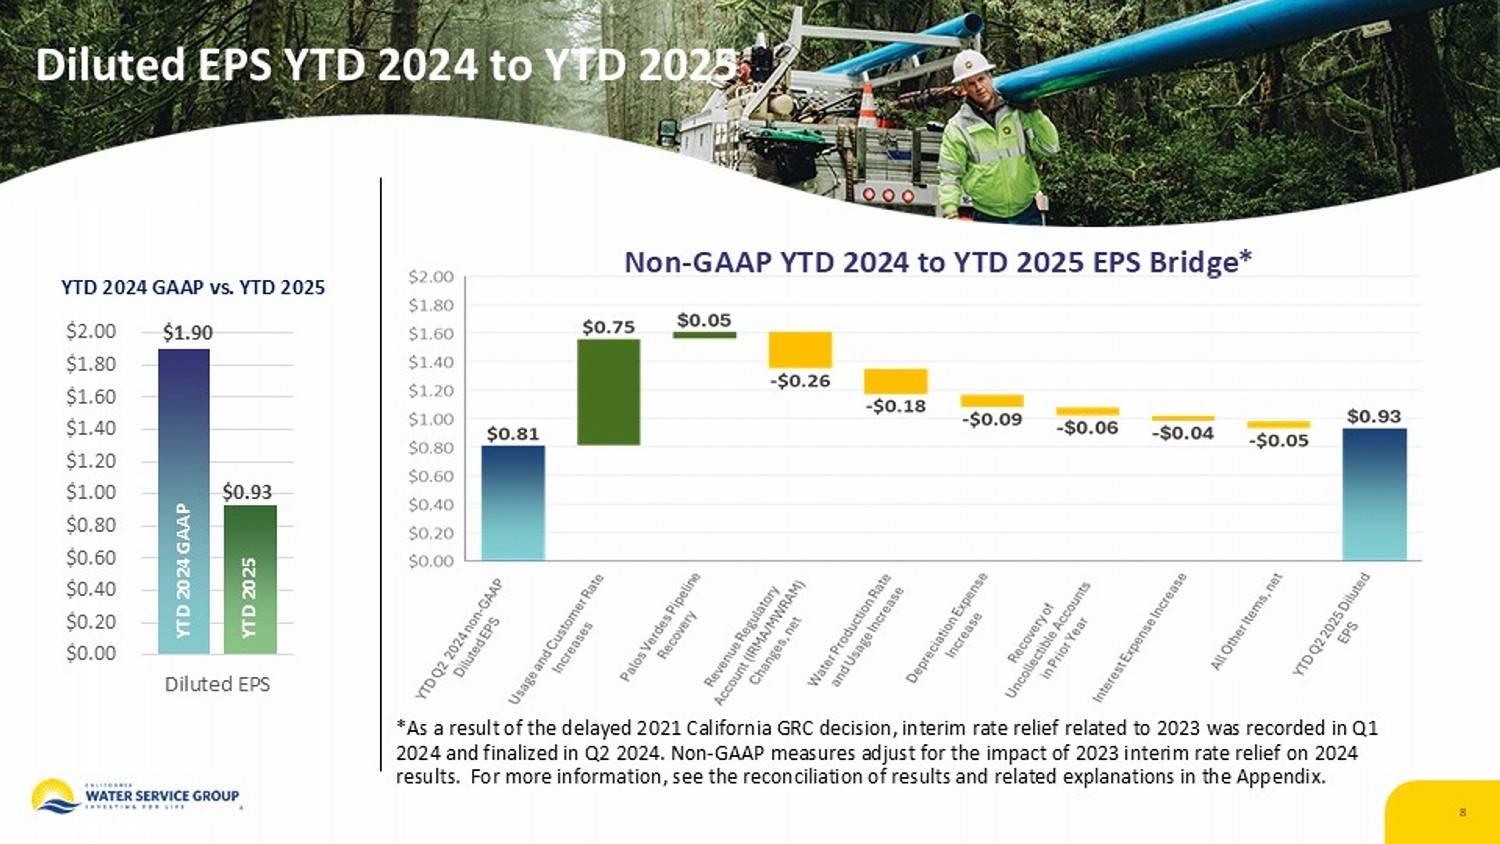
Diluted EPS YTD 2024 to YTD 2025 8 $1.90 $0.93 $0.00 $0.20 $0.40 $0.60 $0.80 $1.00 $1.20 $1.40 $1.60 $1.80 $2.00 Diluted EPS YTD 2024 GAAP vs. YTD 2025 YTD 2024 GAAP YTD 2025 Non - GAAP YTD 2024 to YTD 2025 EPS Bridge *As a result of the delayed 2021 California GRC decision, interim rate relief related to 2023 was recorded in Q1 2024 and finalized in Q2 2024. Non - GAAP measures adjust for the impact of 2023 interim rate relief on 2024 results. For more information, see the reconciliation of results and related explanations in the Appendix.
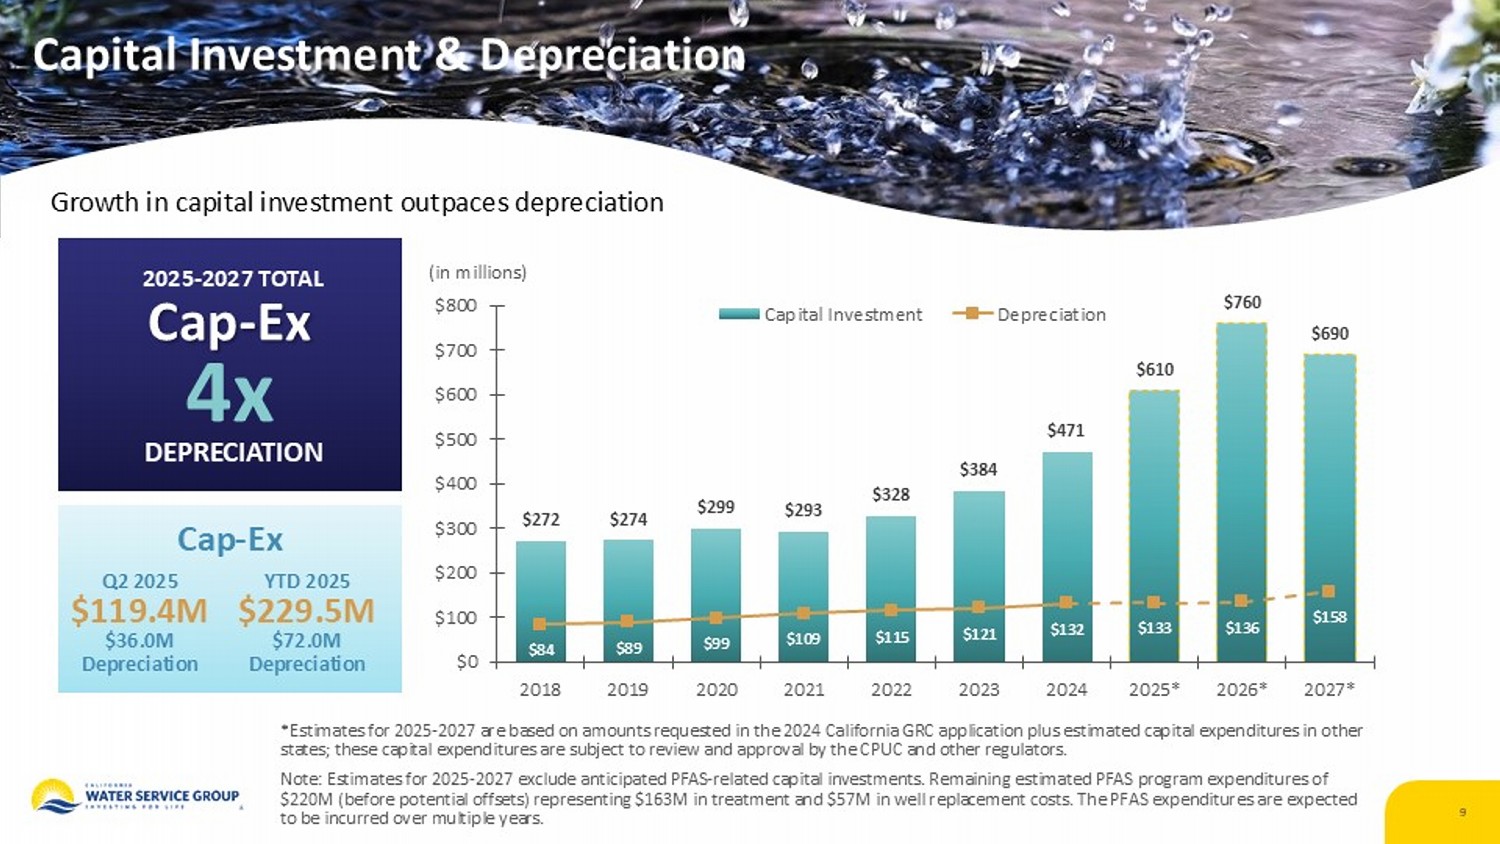
9 Growth in capital investment outpaces depreciation (in millions) 2025 - 2027 TOTAL Cap - Ex 4x DEPRECIATION *Estimates for 2025 - 2027 are based on amounts requested in the 2024 California GRC application plus estimated capital expenditur es in other states; these capital expenditures are subject to review and approval by the CPUC and other regulators. Note: Estimates for 2025 - 2027 exclude anticipated PFAS - related capital investments. Remaining estimated PFAS program expenditure s of $220M (before potential offsets) representing $163M in treatment and $57M in well replacement costs. The PFAS expenditures ar e e xpected to be incurred over multiple years. $272 $274 $299 $293 $328 $384 $471 $610 $760 $690 $84 $89 $99 $109 $115 $121 $132 $133 $136 $158 $0 $100 $200 $300 $400 $500 $600 $700 $800 2018 2019 2020 2021 2022 2023 2024 2025* 2026* 2027* Capital Investment Depreciation Capital Investment & Depreciation Q2 2025 $119.4M $36.0M Depreciation YTD 2025 $ 229.5M $72.0M Depreciation Cap - Ex
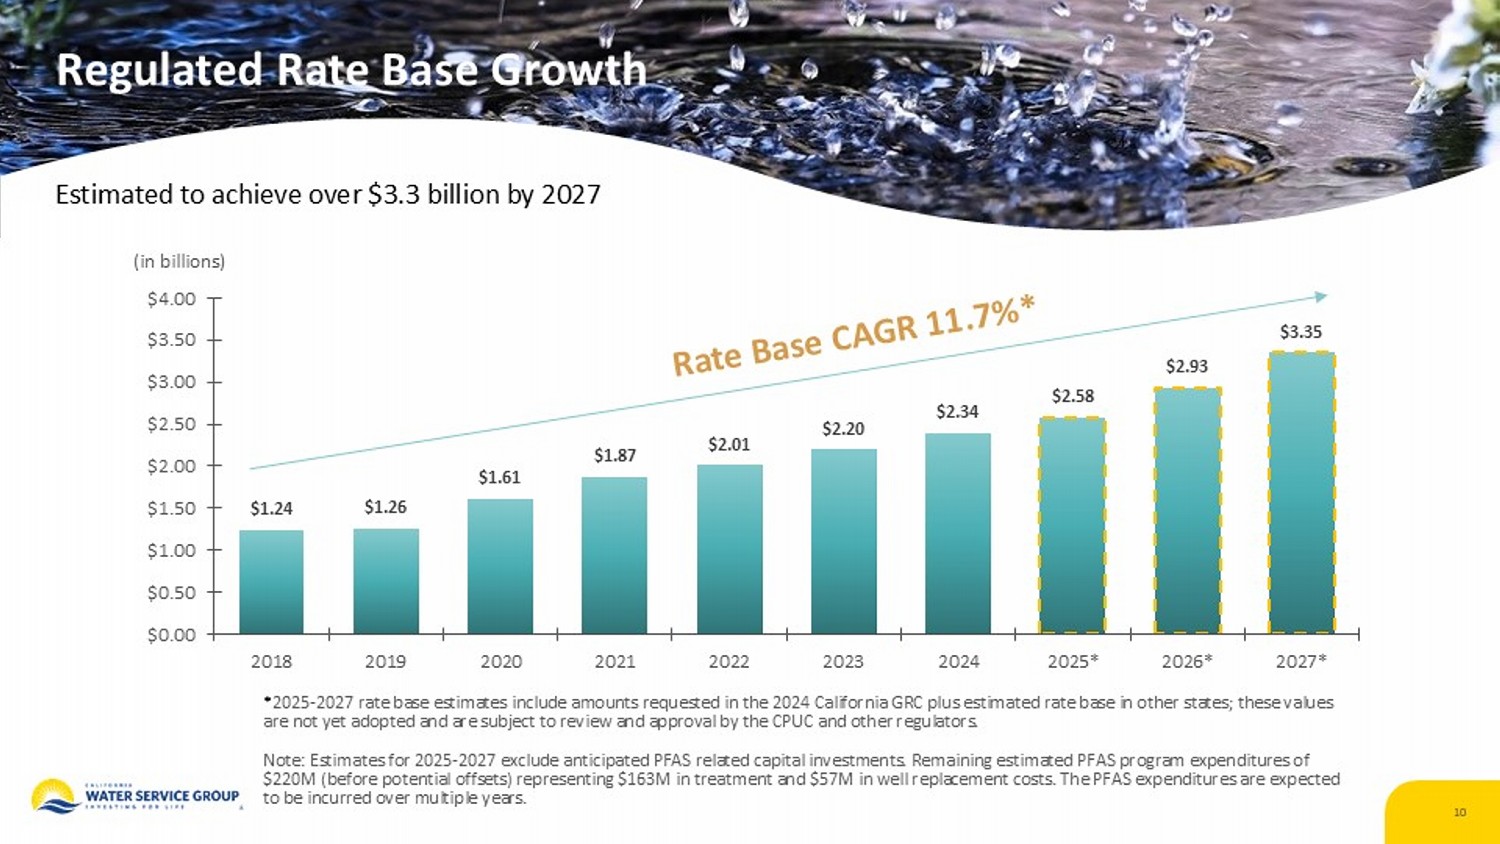
10 Estimated to achieve over $3.3 billion by 2027 * 2025 - 2027 rate base estimates include amounts requested in the 2024 California GRC plus estimated rate base in other states; the se values are not yet adopted and are subject to review and approval by the CPUC and other regulators. Note: Estimates for 2025 - 2027 exclude anticipated PFAS related capital investments. Remaining estimated PFAS program expenditure s of $220M (before potential offsets) representing $163M in treatment and $57M in well replacement costs. The PFAS expenditures ar e e xpected to be incurred over multiple years. Regulated Rate Base Growth $1.24 $1.26 $1.61 $1.87 $2.01 $2.20 $2.34 $2.58 $2.93 $3.35 $0.00 $0.50 $1.00 $1.50 $2.00 $2.50 $3.00 $3.50 $4.00 2018 2019 2020 2021 2022 2023 2024 2025* 2026* 2027* (in billions)
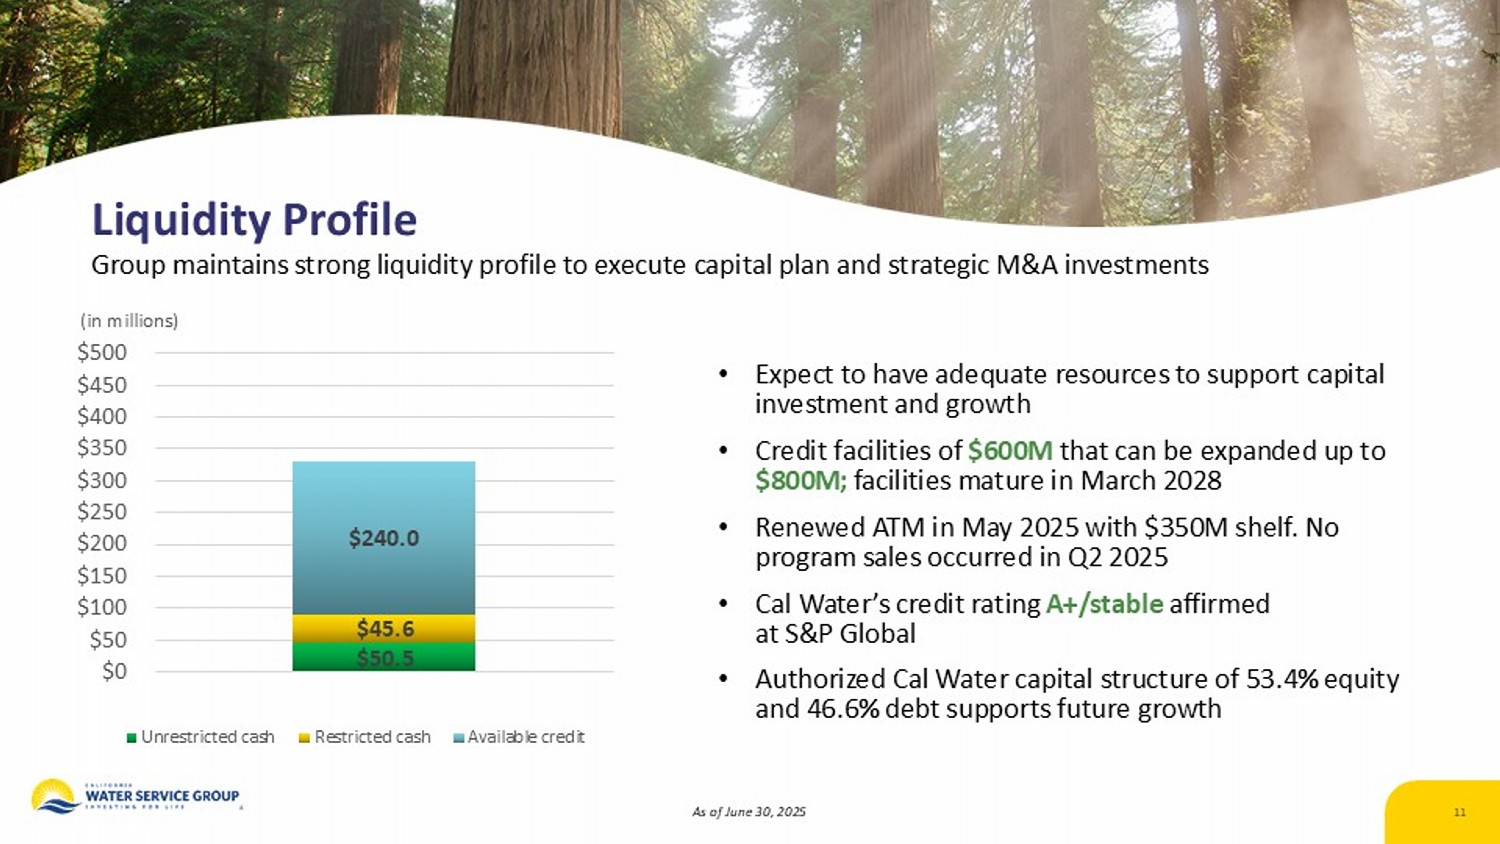
Liquidity Profile Group maintains strong liquidity profile to execute capital plan and strategic M&A investments • Expect to have adequate resources to support capital investment and growth • Credit facilities of $600M that can be expanded up to $800M; facilities mature in March 2028 • Renewed ATM in May 2025 with $350M shelf. No program sales occurred in Q2 2025 • Cal Water’s credit rating A+/stable affirmed at S&P Global • Authorized Cal Water capital structure of 53.4 % equity and 46.6 % debt supports future growth As of June 30,, 2025 11 (in millions) $50.5 $45.6 $240.0 $0 $50 $100 $150 $200 $250 $300 $350 $400 $450 $500 Unrestricted cash Restricted cash Available credit
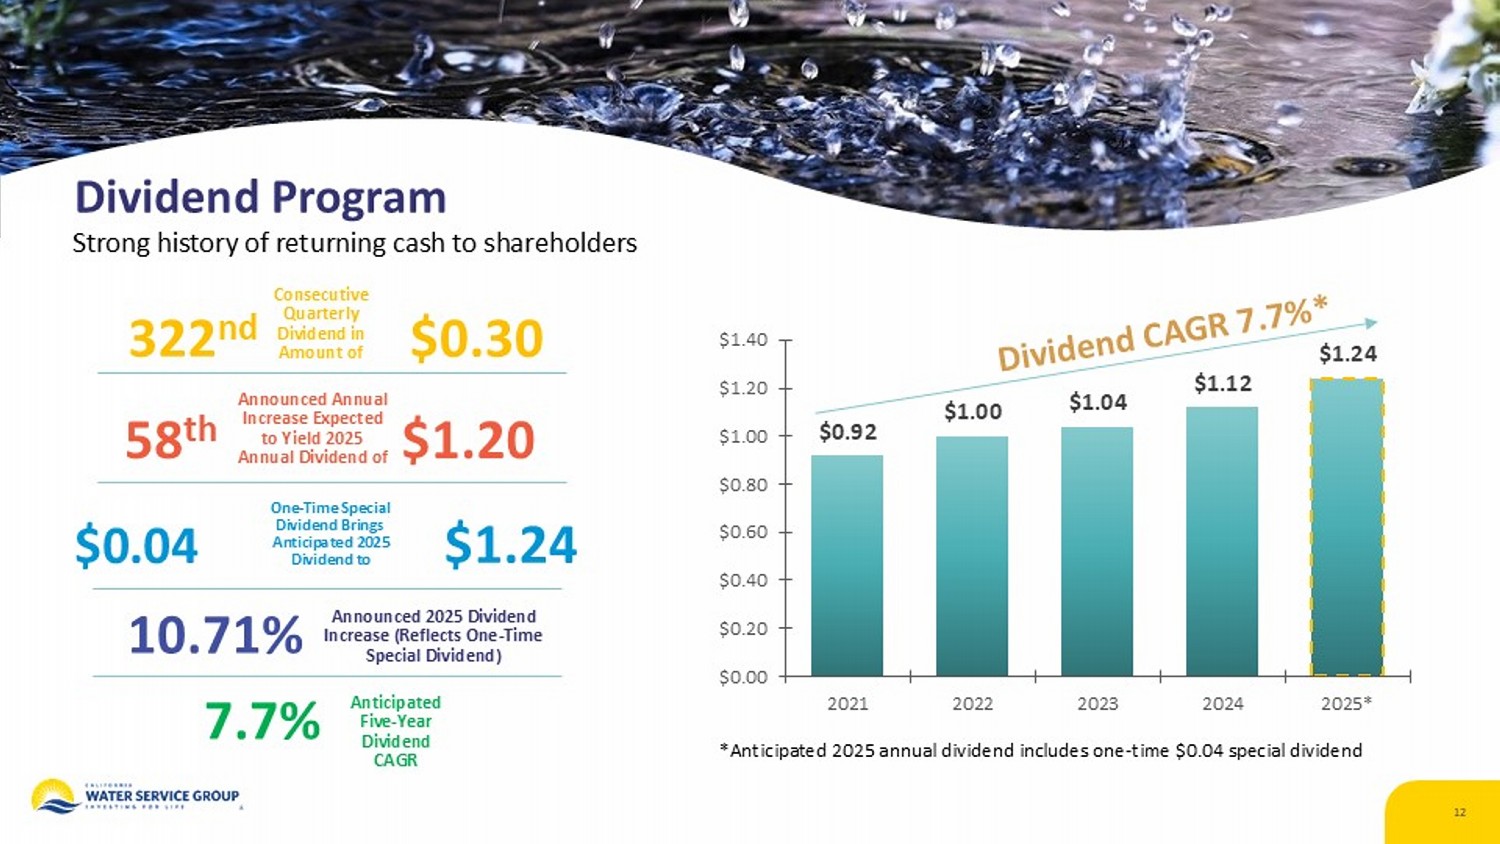
12 Dividend Program Strong history of returning cash to shareholders $0.92 $1.00 $1.04 $1.12 $1.24 $0.00 $0.20 $0.40 $0.60 $0.80 $1.00 $1.20 $1.40 2021 2022 2023 2024 2025* *Anticipated 2025 annual dividend includes one - time $0.04 special dividend 322 nd $0.30 Consecutive Quarterly Dividend in Amount of 58 th $1.20 Announced Annual Increase Expected to Yield 2025 Annual Dividend of $0.04 $1.24 One - Time Special Dividend Brings Anticipated 2025 Dividend to 10.71% Announced 2025 Dividend Increase (Reflects One - Time Special Dividend) 7.7% Anticipated Five - Year Dividend CAGR
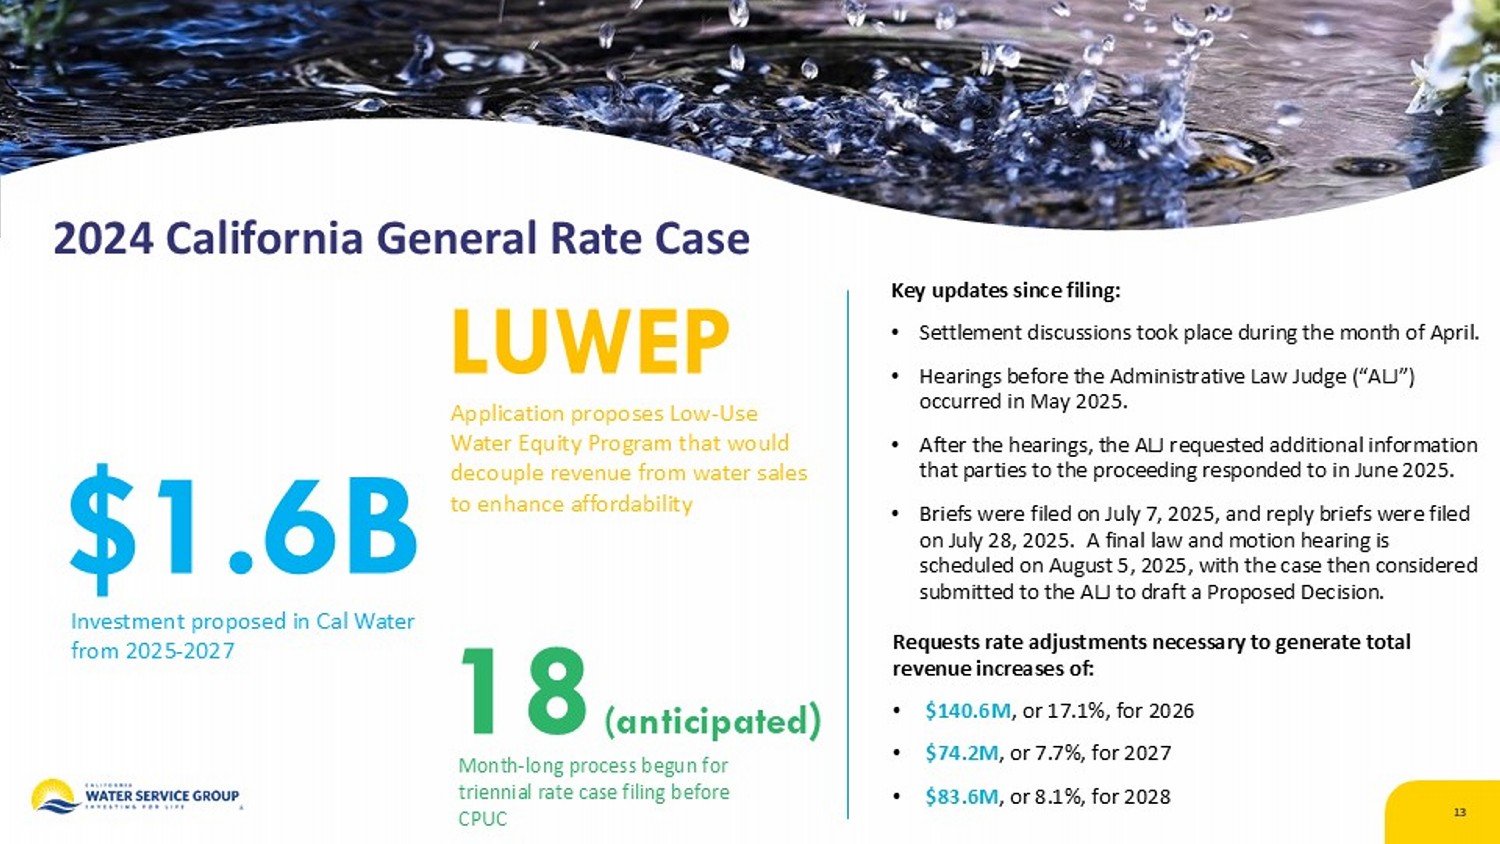
13 2024 California General Rate Case Key updates since filing : • Settlement discussions took place during the month of April. • Hearings before the Administrative Law Judge (“ALJ”) occurred in May 2025. • After the hearings, the ALJ requested additional information that parties to the proceeding responded to in June 2025. • Briefs were filed on July 7, 2025, and reply briefs were filed on July 28, 2025. A final law and motion hearing is scheduled on August 5, 2025, with the case then considered submitted to the ALJ to draft a Proposed Decision. 13 Investment proposed in Cal Water from 2025 - 2027 $1.6B Application proposes Low - Use Water Equity Program that would decouple revenue from water sales to enhance affordability LUWEP Month - long process begun for triennial rate case filing before CPUC 18 (anticipated ) Requests rate adjustments necessary to generate total revenue increases of: • $140.6M , or 17.1%, for 2026 • $74.2M , or 7.7%, for 2027 • $83.6M , or 8.1%, for 2028
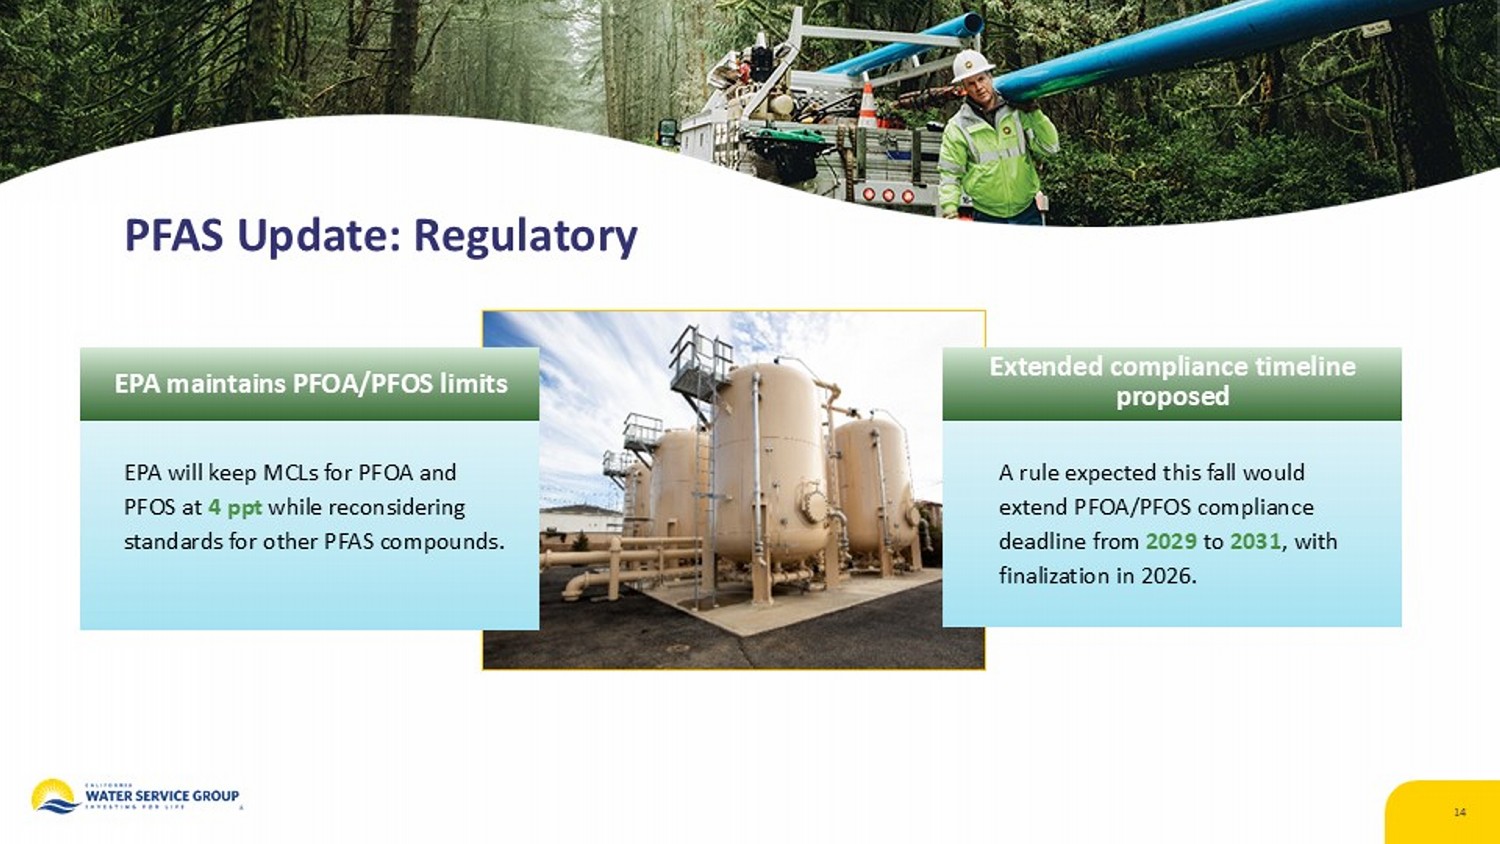
14 PFAS Update: Regulatory EPA will keep MCLs for PFOA and PFOS at 4 ppt while reconsidering standards for other PFAS compounds. EPA maintains PFOA/PFOS limits A rule expected this fall would extend PFOA/PFOS compliance deadline from 2029 to 2031 , with finalization in 2026. Extended compliance timeline proposed
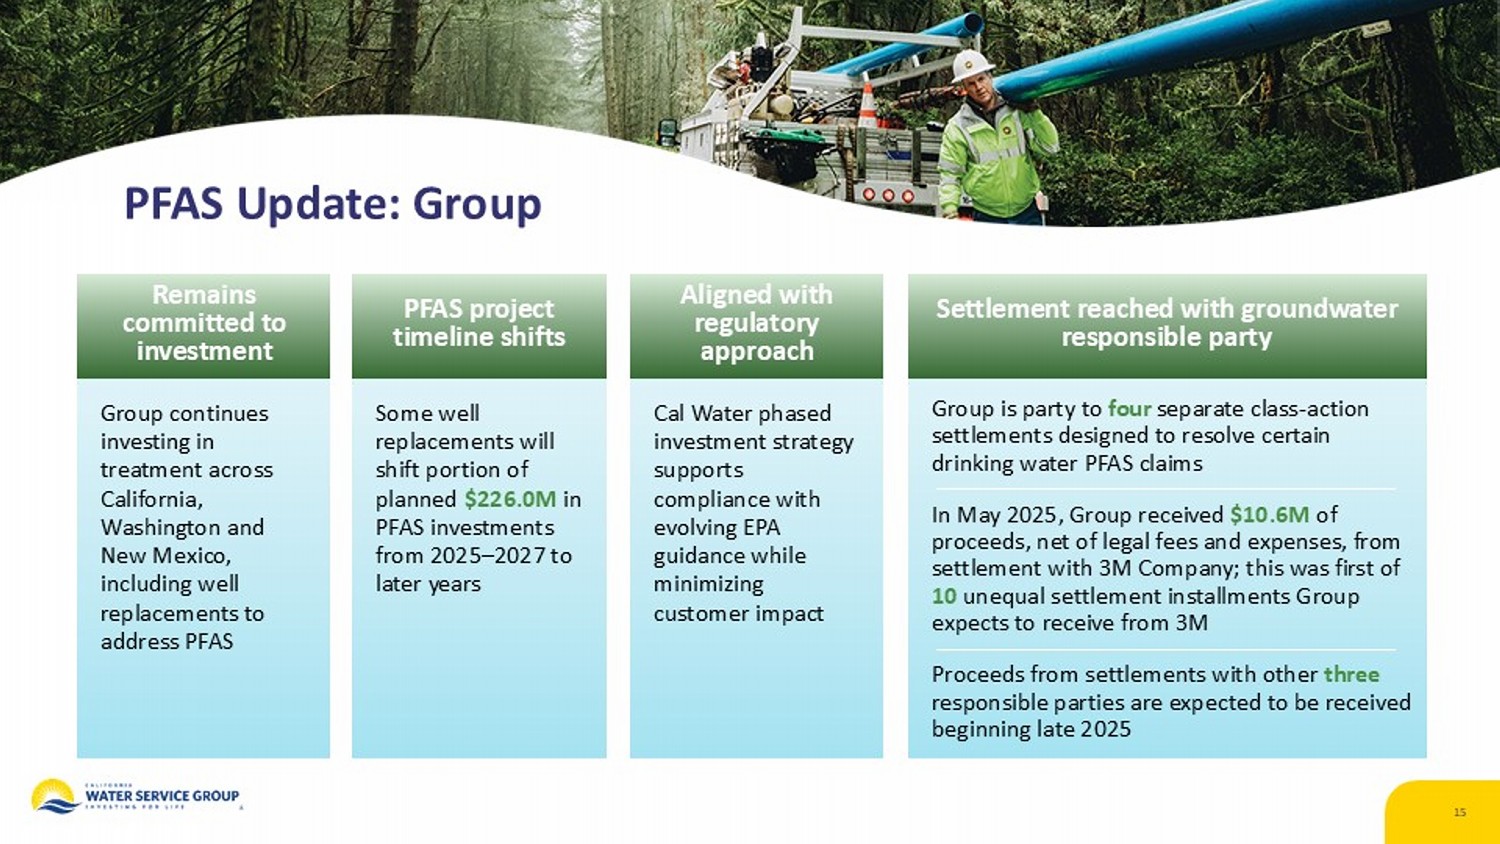
15 PFAS Update: Group Group continues investing in treatment across California, Washington and New Mexico, including well replacements to address PFAS Remains committed to investment Some well replacements will shift portion of planned $226.0M in PFAS investments from 2025 – 2027 to later years PFAS project timeline shifts Cal Water phased investment strategy supports compliance with evolving EPA guidance while minimizing customer impact Aligned with regulatory approach Group is party to four separate class - action settlements designed to resolve certain drinking water PFAS claims In May 2025, Group received $10.6M of proceeds, net of legal fees and expenses, from settlement with 3M Company; this was first of 10 unequal settlement installments Group expects to receive from 3M Proceeds from settlements with other three responsible parties are expected to be received beginning late 2025 Settlement reached with groundwater responsible party
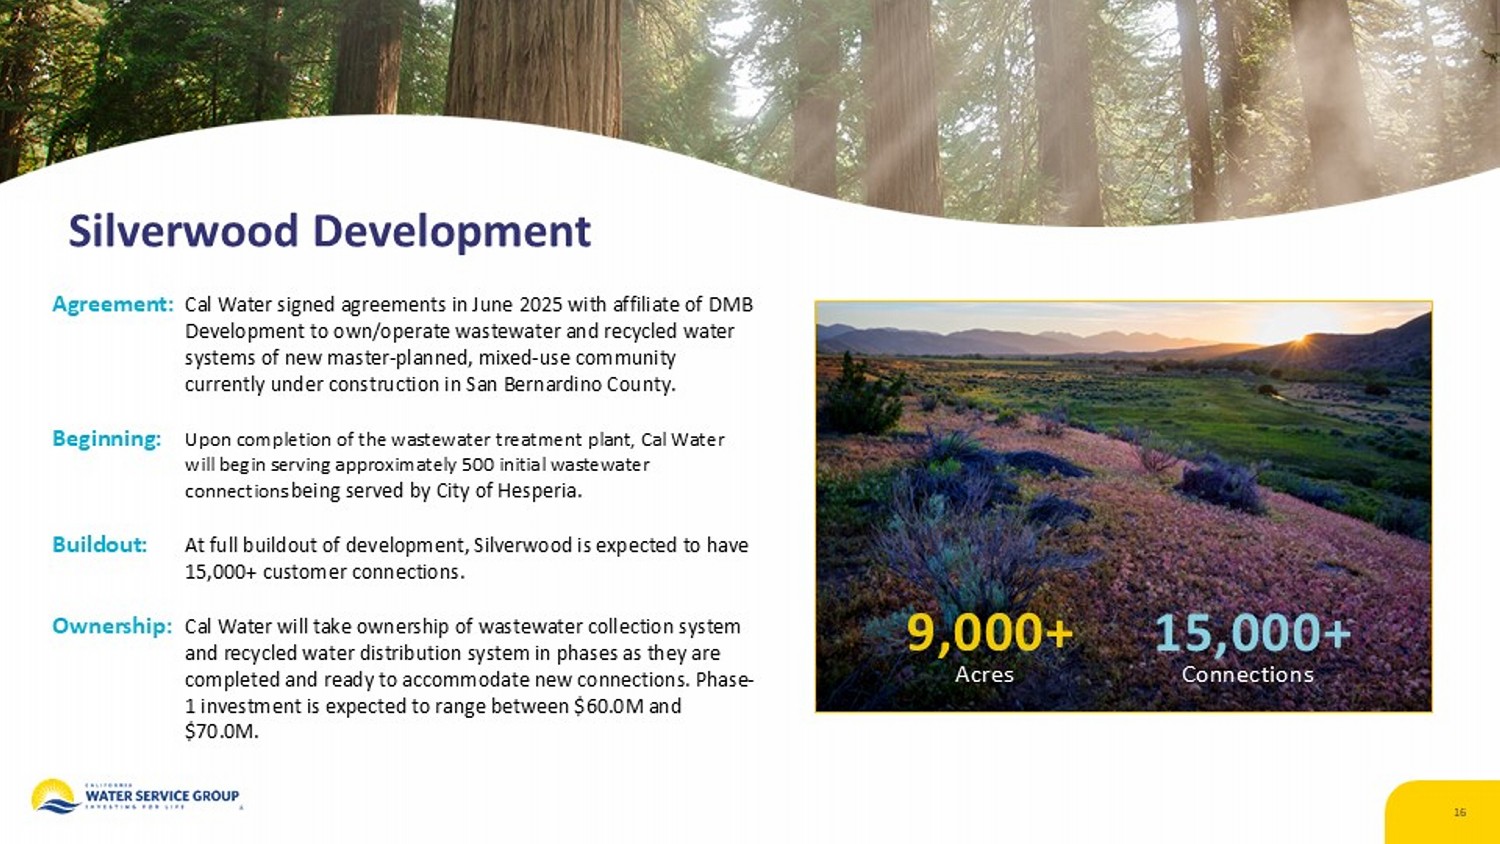
Silverwood Development 16 Agreement: Cal Water signed agreements in June 2025 with affiliate of DMB Development to own/operate wastewater and recycled water systems of new master - planned, mixed - use community currently under construction in San Bernardino County. Beginning: Upon completion of the wastewater treatment plant, Cal Water will begin serving approximately 500 initial wastewater connections being served by City of Hesperia. Buildout: At full buildout of development, Silverwood is expected to have 15,000+ customer connections. Ownership: Cal Water will take ownership of wastewater collection system and recycled water distribution system in phases as they are completed and ready to accommodate new connections. Phase - 1 investment is expected to range between $60.0M and $70.0M. 9,000+ Acres 15,000+ Connections
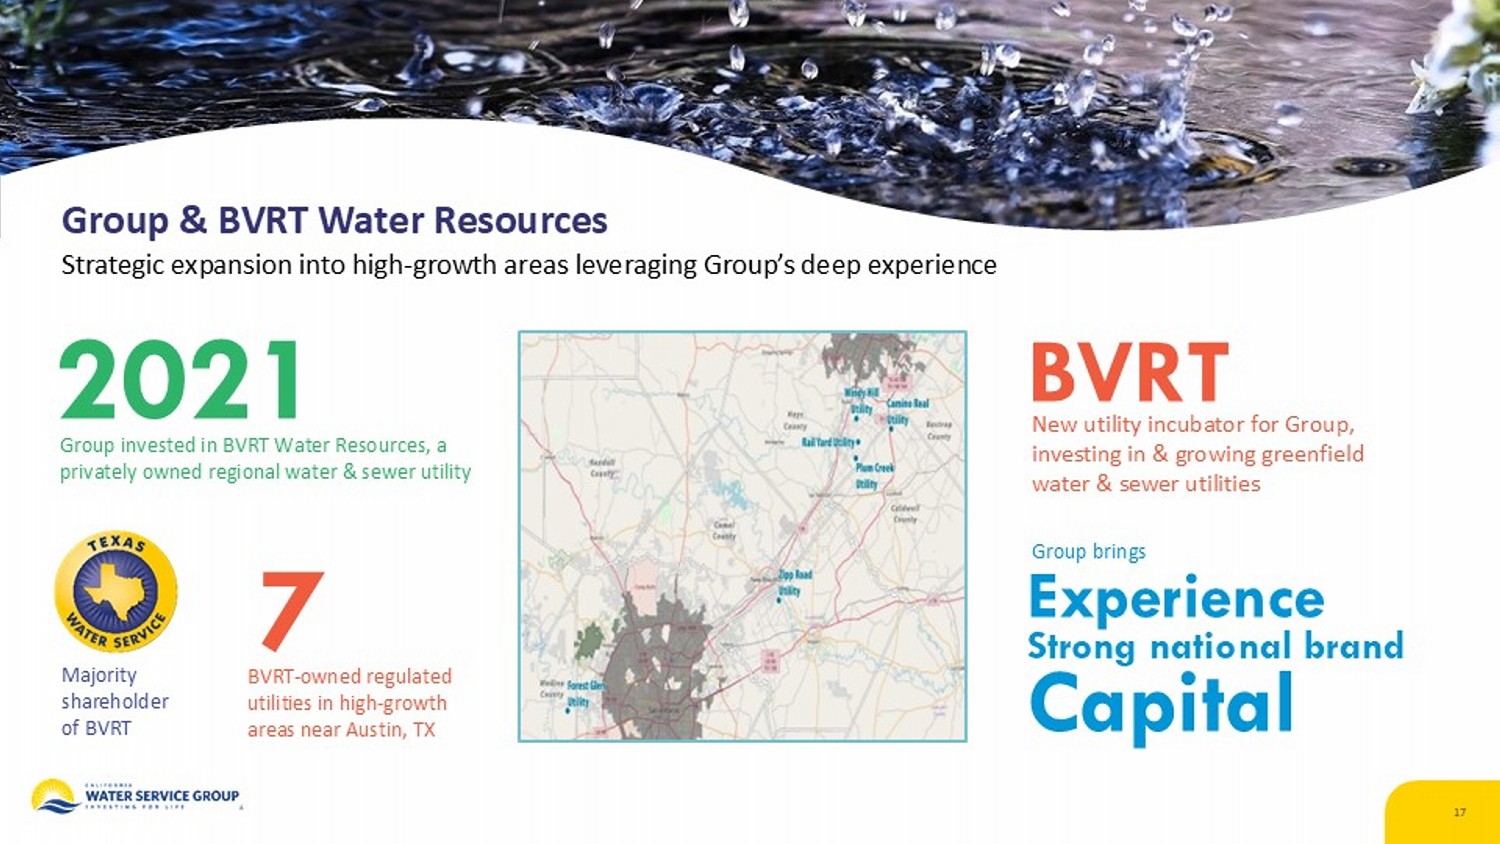
17 Group & BVRT Water Resources Strategic expansion into high - growth areas leveraging Group’s deep experience Group invested in BVRT Water Resources, a privately owned regional water & sewer utility Majority shareholder of BVRT Group brings New utility incubator for Group, investing in & growing greenfield water & sewer utilities BVRT - owned regulated utilities in high - growth areas near Austin, TX 7 2021 Experience Strong national brand Capital BVRT
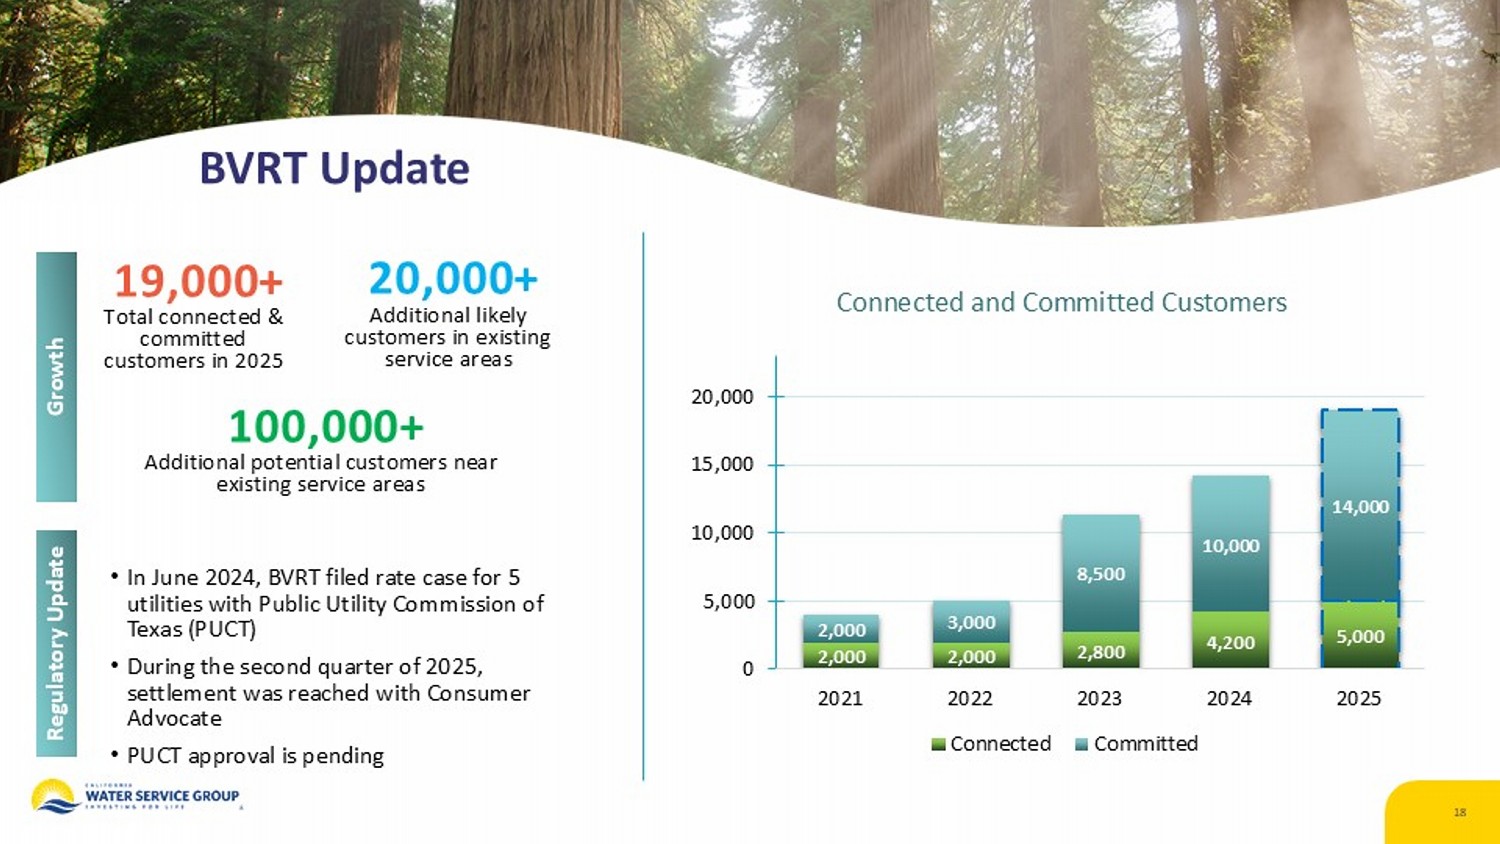
BVRT Update 18 19,000+ Total connected & committed customers in 2025 20,000+ Additional likely customers in existing service areas 100,000+ Additional potential customers near existing service areas Growth • In June 2024, BVRT filed rate case for 5 utilities with Public Utility Commission of Texas (PUCT) • During the second quarter of 2025, settlement was reached with Consumer Advocate • PUCT approval is pending Regulatory Update 2,000 2,000 2,800 4,200 5,000 2,000 3,000 8,500 10,000 14,000 0 5,000 10,000 15,000 20,000 2021 2022 2023 2024 2025 Connected and Committed Customers Connected Committed
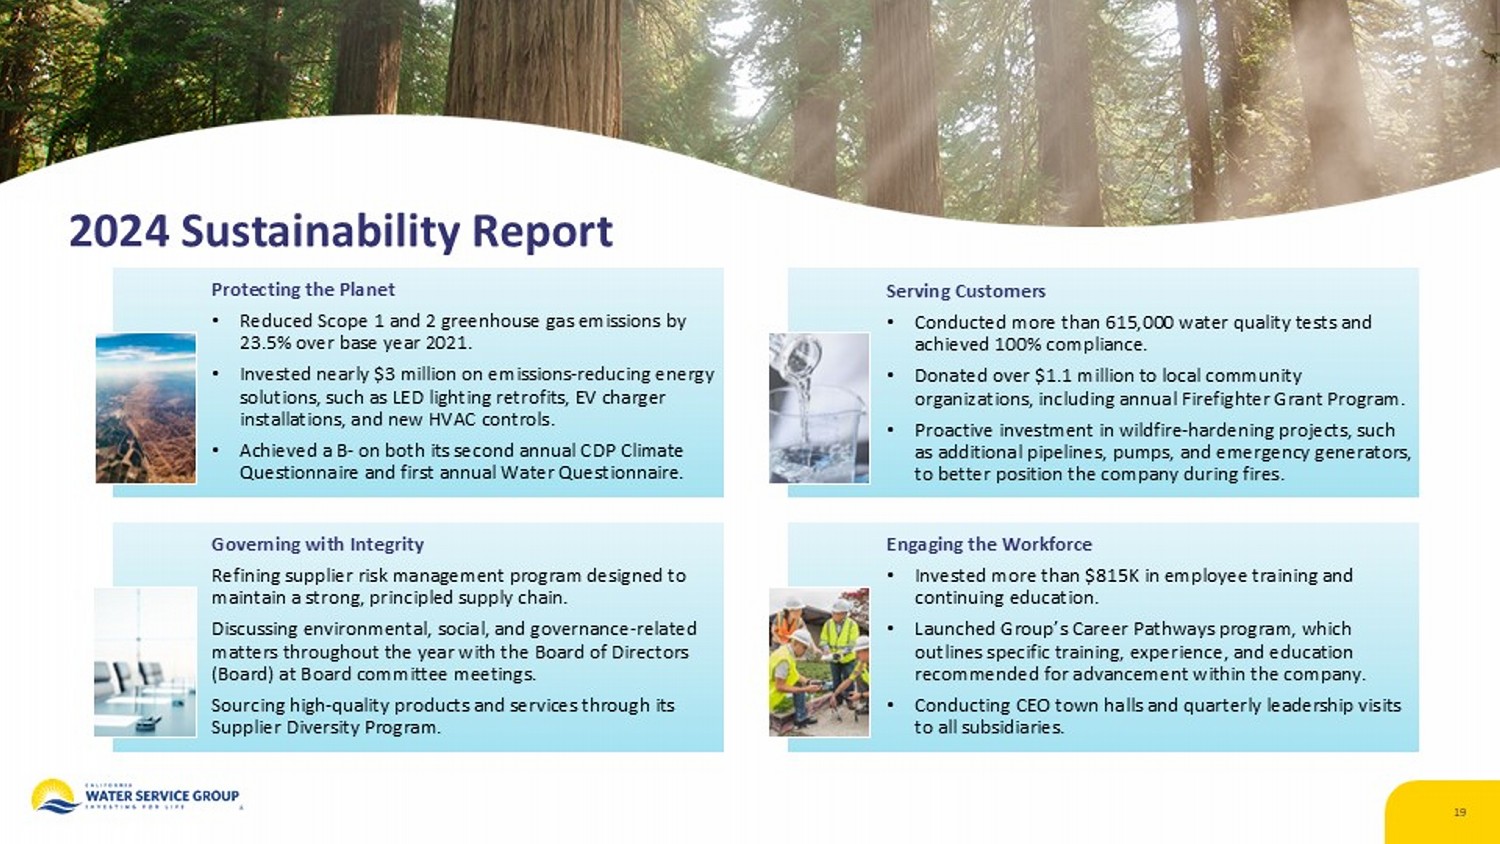
2024 Sustainability Report 19 Protecting the Planet • Reduced Scope 1 and 2 greenhouse gas emissions by 23.5% over base year 2021. • Invested nearly $3 million on emissions - reducing energy solutions, such as LED lighting retrofits, EV charger installations, and new HVAC controls. • Achieved a B - on both its second annual CDP Climate Questionnaire and first annual Water Questionnaire. Serving Customers • Conducted more than 615,000 water quality tests and achieved 100% compliance. • Donated over $1.1 million to local community organizations, including annual Firefighter Grant Program. • Proactive investment in wildfire - hardening projects, such as additional pipelines, pumps, and emergency generators, to better position the company during fires. Governing with Integrity Refining supplier risk management program designed to maintain a strong, principled supply chain. Discussing environmental, social, and governance - related matters throughout the year with the Board of Directors (Board) at Board committee meetings. Sourcing high - quality products and services through its Supplier Diversity Program. Engaging the Workforce • Invested more than $815K in employee training and continuing education. • Launched Group’s Career Pathways program, which outlines specific training, experience, and education recommended for advancement within the company. • Conducting CEO town halls and quarterly leadership visits to all subsidiaries.
Appendix
21 The Company’s revenue, net income, and diluted earnings per share are prepared in accordance with Generally Accepted Accounti ng Principles (GAAP) and represent amounts reported on filings with the Securities and Exchange Commission. Adjusted revenue, ne t income, and diluted earnings per share are non - GAAP financial measures representing GAAP balances that, in this earnings presentation , are adjusted to exclude the effects of 2023 interim rate relief related to the delayed 2021 California GRC decision recorded by the Company in March 2024 and finalized in the second quarter of 2024. These non - GAAP financial measures are provided as additional information for investors and analysts to better assess the Company’s 2025 financial performance as compared to 20 24 without the impact of the 2023 interim rate relief on 2024 results. Management also uses these non - GAAP financial measures in evaluating the Company’s performance. These non - GAAP financial measures may be different from non - GAAP financial measures used by other companies, even when the same or similarly titled terms are used to identify such measures, limiting their usefulnes s f or comparative purposes. Further, these non - GAAP financial measures should be considered as a supplement to the financial informati on prepared on a GAAP basis rather than an alternative to the respective GAAP measures. Non - GAAP Financial Measures
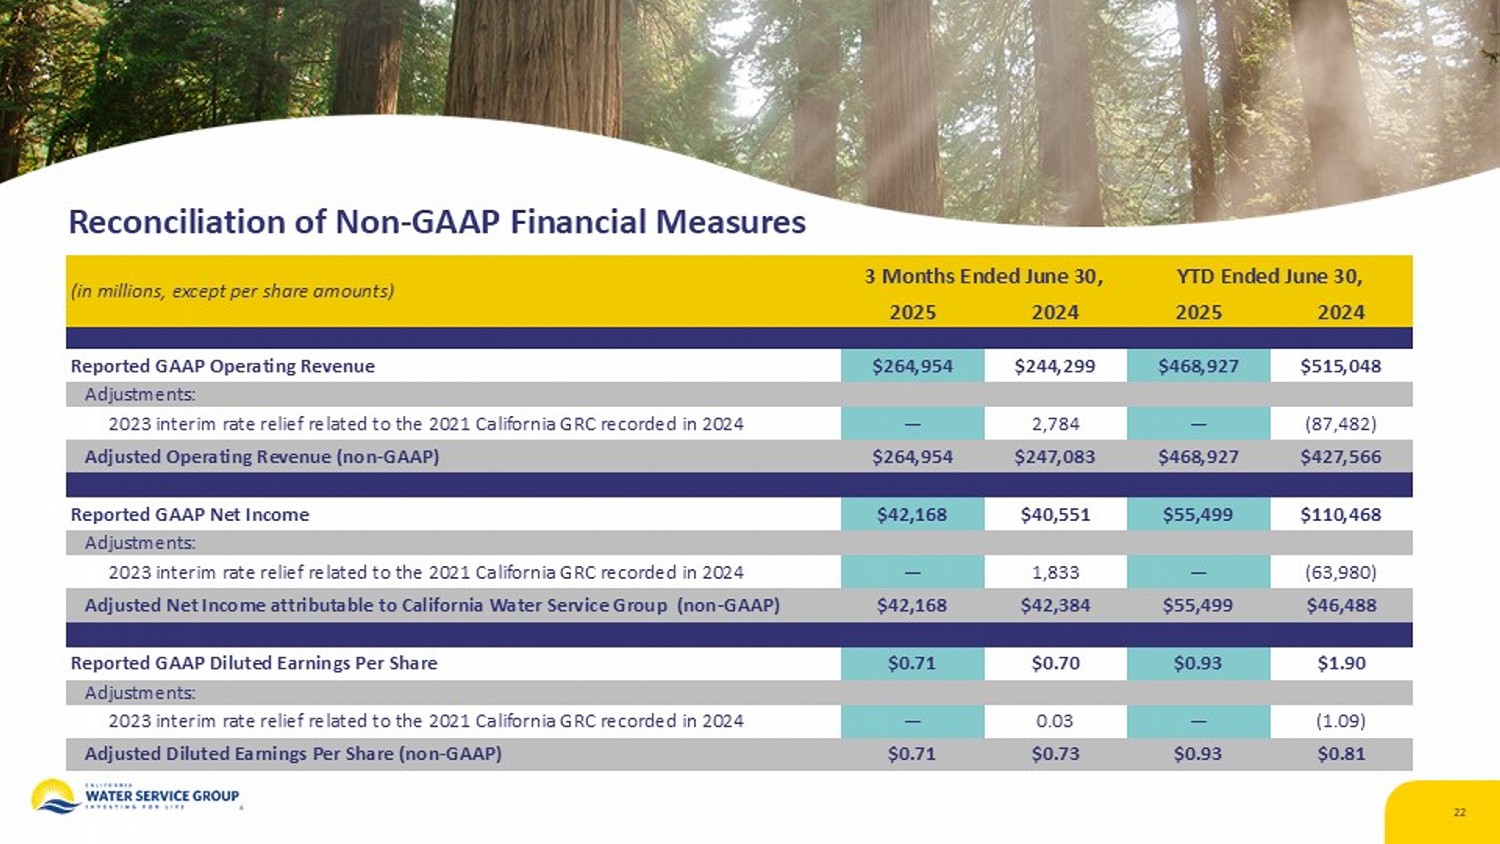
Reconciliation of Non - GAAP Financial Measures 22 YTD Ended June 30, 3 Months Ended June 30, (in millions, except per share amounts) 2024 2025 2024 2025 $515,048 $468,927 $244,299 $264,954 Reported GAAP Operating Revenue Adjustments: (87,482) — 2,784 — 2023 interim rate relief related to the 2021 California GRC recorded in 2024 $427,566 $468,927 $247,083 $264,954 Adjusted Operating Revenue (non - GAAP) $110,468 $55,499 $40,551 $42,168 Reported GAAP Net Income Adjustments: (63,980) — 1,833 — 2023 interim rate relief related to the 2021 California GRC recorded in 2024 $46,488 $55,499 $42,384 $42,168 Adjusted Net Income attributable to California Water Service Group (non - GAAP) $1.90 $0.93 $0.70 $0.71 Reported GAAP Diluted Earnings Per Share Adjustments: (1.09) — 0.03 — 2023 interim rate relief related to the 2021 California GRC recorded in 2024 $0.81 $0.93 $0.73 $0.71 Adjusted Diluted Earnings Per Share (non - GAAP)