EXHIBIT 99.2
Published on July 27, 2023
Exhibit 99.2
0 Second Quarter 2023 Results Presentation July 27, 2023
INVESTOR RELATIONS Forward - Looking Statements This presentation contains forward - looking statements within the meaning established by the Private Securities Litigation Reform Act of 1995 ("PSLRA"). The forward - looking statements are intended to qualify under provisions of the federal securities laws for "safe harbor" treatment established by th e PSLRA. Forward - looking statements in this presentation are based on currently available information, expectations, estimates, assumptions and projections, and our management’s beli ef s, assumptions, judgments and expectations about us, the water utility industry and general economic conditions. These statements are not statements of his tor ical fact. When used in our documents, statements that are not historical in nature, including words like will, would, expects, intends, plans, believes, may, could , e stimates, assumes, anticipates, projects, progress, predicts, hopes, targets, forecasts, should, seeks or variations of these words or similar expressions are intended to identi fy forward - looking statements. Examples of forward - looking statements in this presentation include, but are not limited to, statements describing future rates, effects of DREMA, IRMA, and MWRAM, completion of pending acquisitions, estimated investments and depreciation, rate base estimates, expectations regarding the 2021 GRC filing and the regulatory process and the estimated impacts related thereto, and proposed capital expenditures. Forward - looking statements are not guarantees of future performance. They ar e based on numerous assumptions that we believe are reasonable, but they are open to a wide range of uncertainties and business risks. Consequently, actual results m ay vary materially from what is contained in a forward - looking statement. Factors that may cause actual results to be different than those expected or anticipated include, but are not limited to: the impact of the ongoing COVID - 19 pandemic and related public health measures; our ability to invest or apply the proceeds from the issuance of common st ock in an accretive manner; governmental and regulatory commissions' decisions, including decisions on proper disposition of property; consequences of eminent domain acti ons relating to our water systems; changes in regulatory commissions' policies and procedures , such as the CPUC’s decision in 2020 to preclude companies from proposing fully decoupled WRAMs in their next GRC filing (which impacted our 2021 GRC filing related to our operations commencing in 2023) ; the outcome and timeliness of regulatory commissions' actions concerning rate relief and other matters, including with respect to our 2021 GRC filing; increased risk of inverse condemnation losses as a result of cl ima te change and drought; our ability to renew leases to operate water systems owned by others on beneficial terms; changes in California State Water Resources Control Board water qu ality standards; changes in environmental compliance and water quality requirements; electric power interruptions, especially as a result of Public Safety Power Shutof f ( PSPS) programs; housing and customer growth; the impact of opposition to rate increases; our ability to recover costs; availability of water supplies; issues with the impleme nta tion, maintenance or security of our information technology systems; civil disturbances or terrorist threats or acts; the adequacy of our efforts to mitigate physical and cy ber security risks and threats; the ability of our enterprise risk management processes to identify or address risks adequately; labor relations matters as we negotiate with the unions; c han ges in customer water use patterns and the effects of conservation, including as a result of drought conditions; our ability to complete, in a timely manner or at all, suc cessfully integrate and achieve anticipated benefits from announced acquisitions; the impact of weather, climate change, natural disasters, and actual or threatened public health em ergencies, including disease outbreaks, on our operations, water quality, water availability, water sales and operating results and the adequacy of our emergency preparedne ss; restrictive covenants in or changes to the credit ratings on our current or future debt that could increase our financing costs or affect our ability to borrow, make payments on debt or pay dividends; risks associated with expanding our business and operations geographically; the impact of stagnating or worsening business and economic conditions, in cluding inflationary pressures, general economic slowdown or a recession, increasing interest rates, and changes in monetary policy; the impact of market conditions and volatility on unrealized gains or losses on our non - qualified benefit plan investments and our operating results; the impact of weather and timing of meter reads on our accrued unbilled revenue; and other risks and unforeseen events described in our SEC filings. When considering forward - looking statements, you should keep in mind the caution ary statements included in this paragraph, as well as the Annual 10 - K, Quarterly 10 - Q, and other reports filed from time - to - time with the Securities and Exchange Commission ( SEC). We are not under any obligation, and we expressly disclaim any obligation to update or alter any forward - looking statements, whether as a result of new information, fut ure events or otherwise. 1
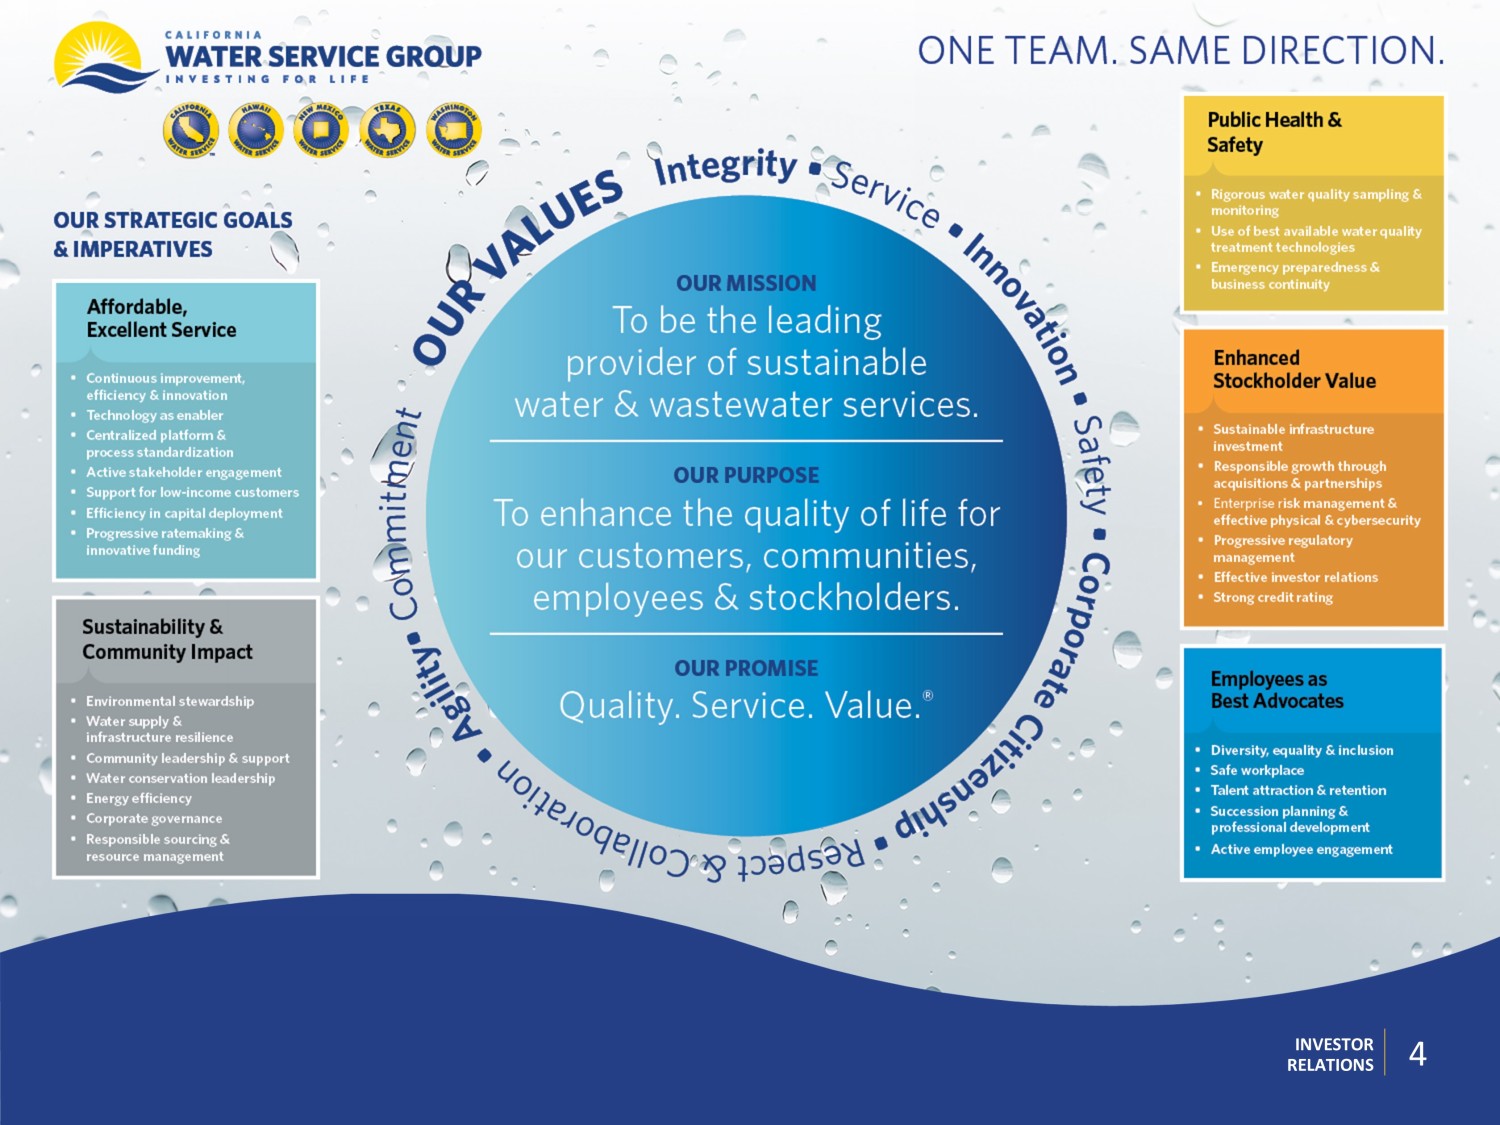
INVESTOR RELATIONS David Healey Vice President, CFO & Treasurer Greg Milleman Vice President, Rates & Regulatory Affairs Marty Kropelnicki President & CEO Today’s Participants 2
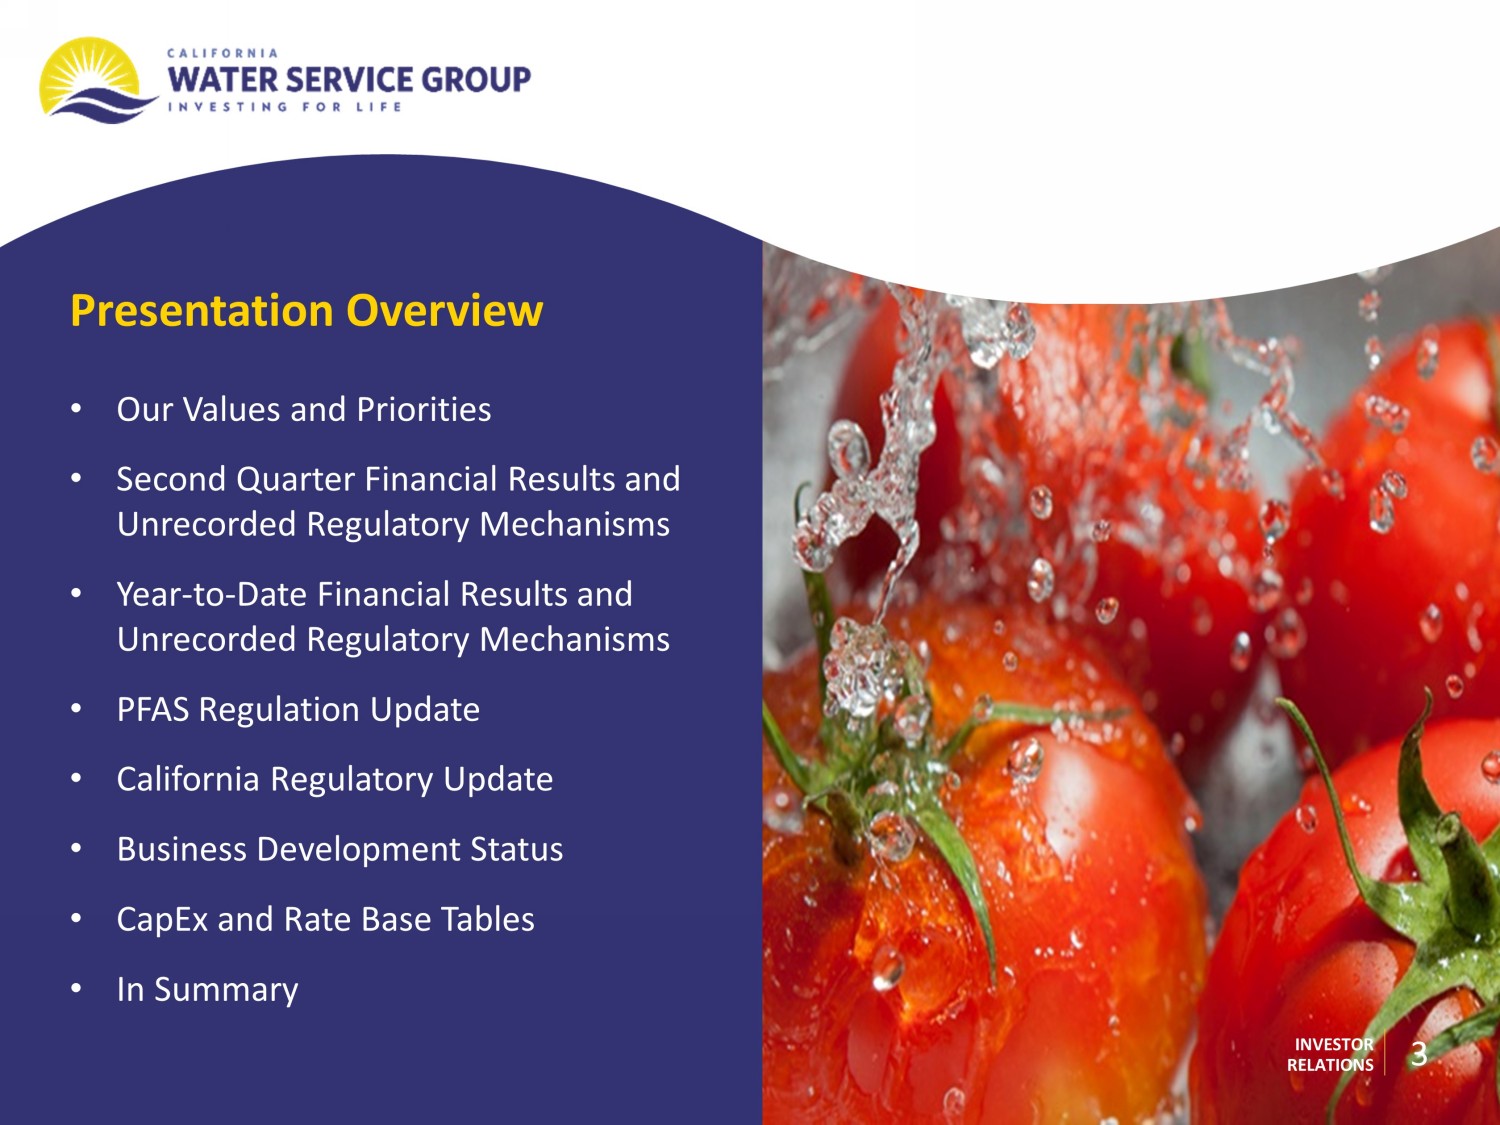
INVESTOR RELATIONS Presentation Overview • Our Values and Priorities • Second Quarter Financial Results and Unrecorded Regulatory Mechanisms • Year - to - Date Financial Results and Unrecorded Regulatory Mechanisms • PFAS Regulation Update • California Regulatory Update • Business Development Status • CapEx and Rate Base Tables • In Summary 3
4 BOARD UPDATE 4 BOARD UPDATE INVESTOR RELATIONS 4
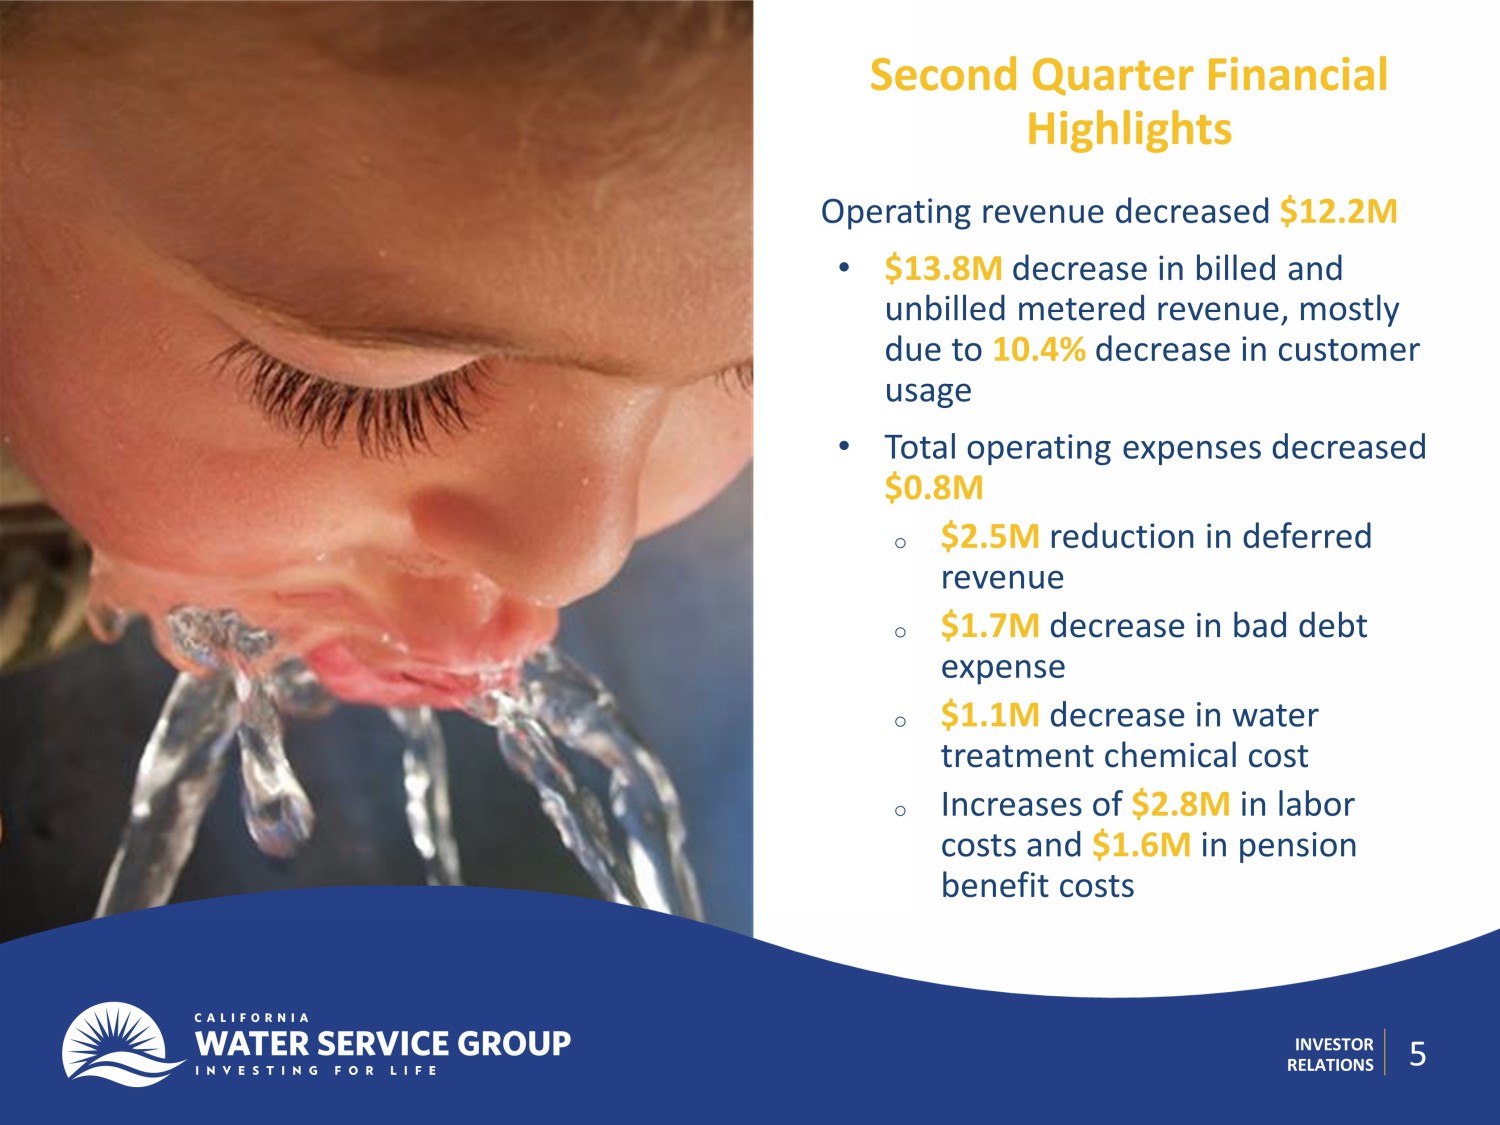
INVESTOR RELATIONS Second Quarter Financial Highlights 5 Operating revenue decreased $ 12.2M • $ 13.8M decrease in billed and unbilled metered revenue, mostly due to 10.4% decrease in customer usage • Total operating expenses decreased $ 0.8M o $2.5M reduction in deferred revenue o $1.7M decrease in bad debt expense o $1.1M decrease in water treatment chemical cost o Increases of $2.8M in labor costs and $1.6M in pension benefit costs
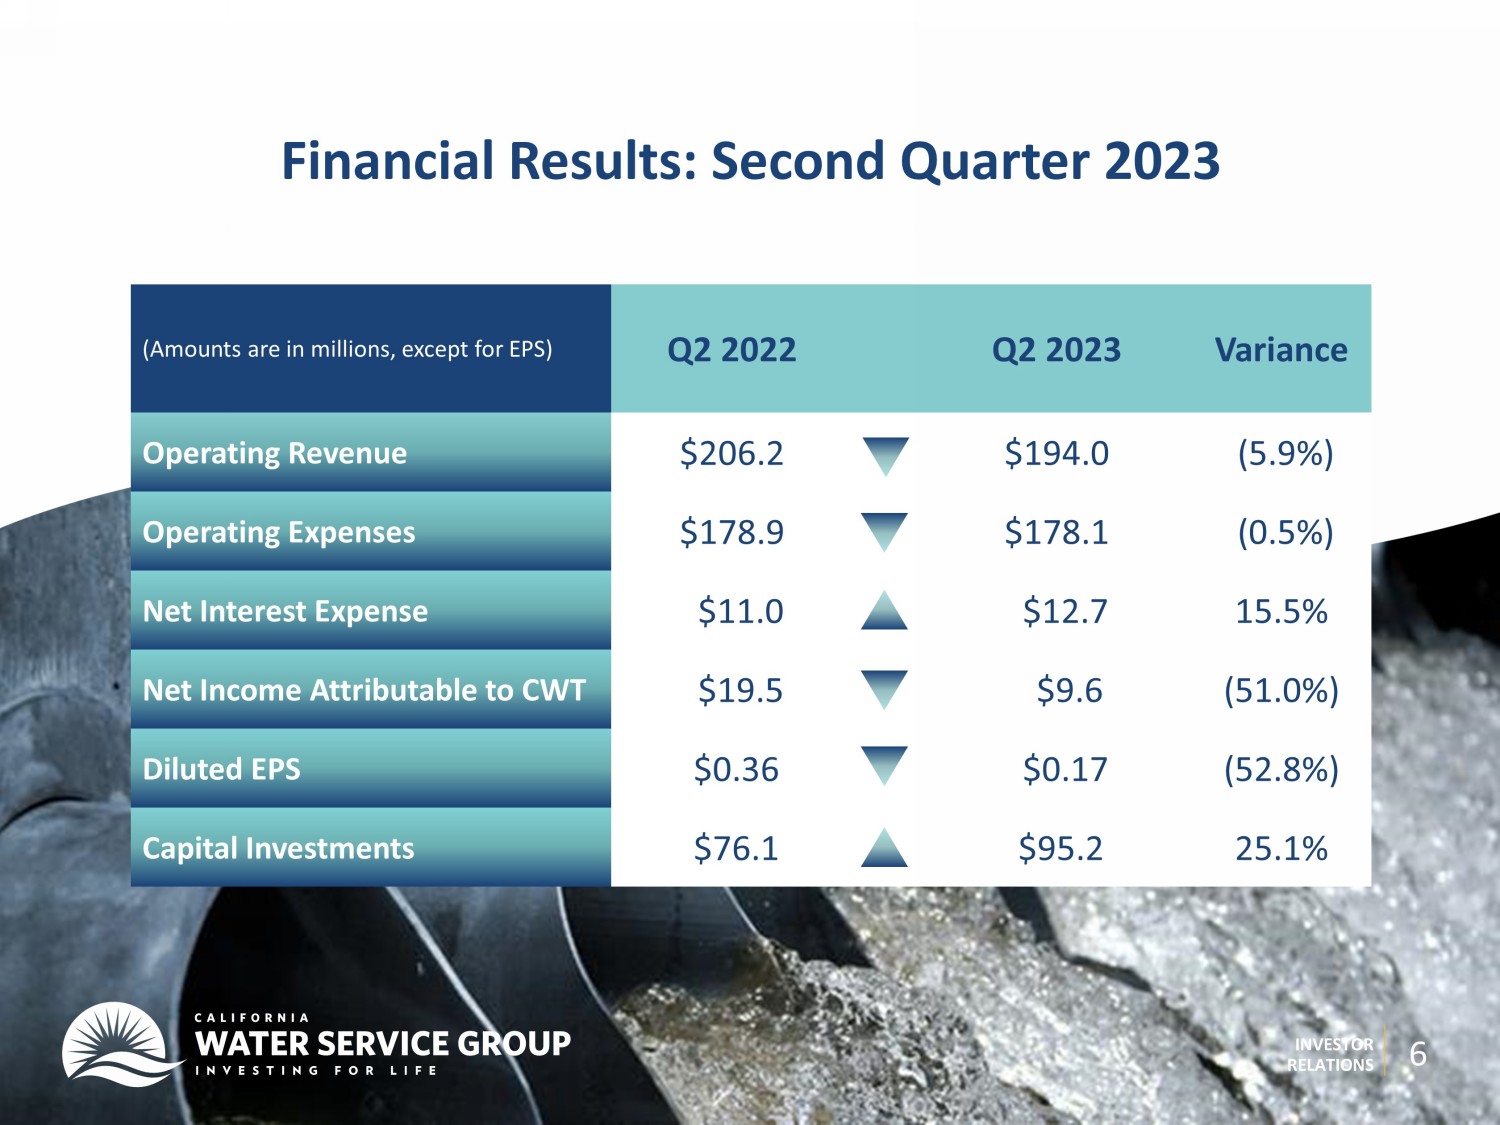
INVESTOR RELATIONS (Amounts are in millions, except for EPS) Q2 2022 Q2 2023 Variance Operating Revenue $206.2 $194.0 (5.9%) Operating Expenses $178.9 $178.1 (0.5%) Net Interest Expense $11.0 $12.7 15.5% Net In come Attributable to CWT $19.5 $9.6 (51.0%) Diluted EPS $0.36 $0.17 (52.8%) Capital Investments $76.1 $95.2 25.1% Financial Results: Second Quarter 2023 6
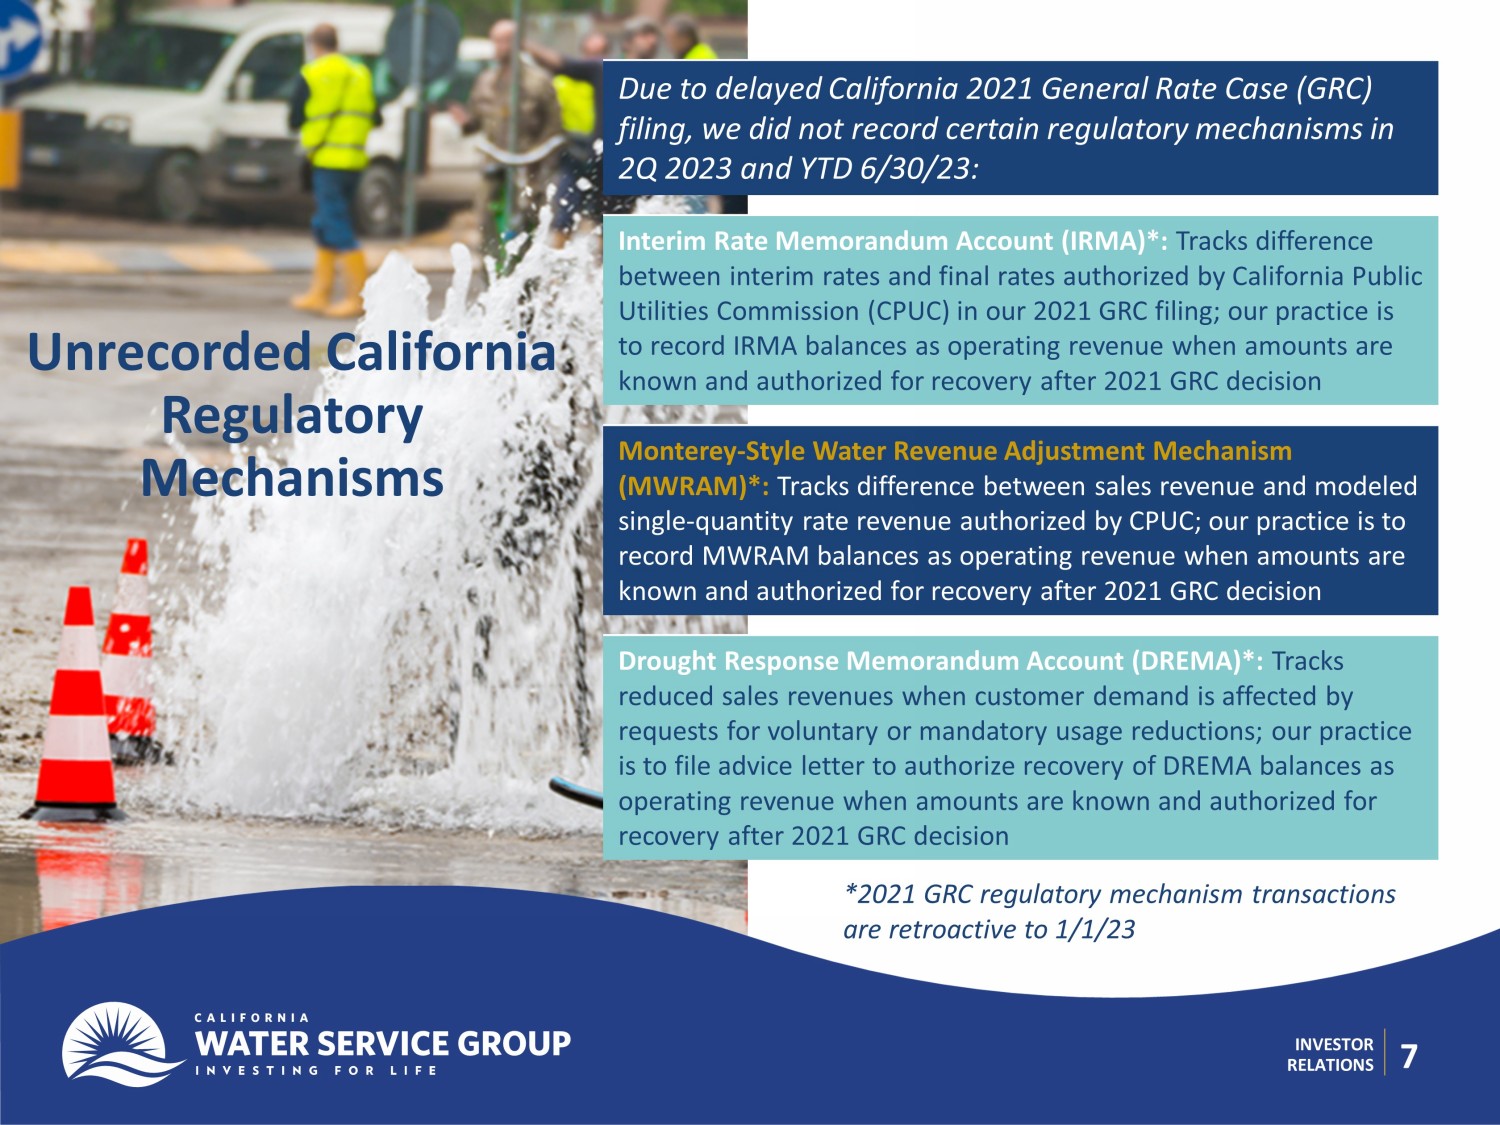
7 INVESTOR RELATIONS Unrecorded California Regulatory Mechanisms Due to delayed California 2021 General Rate Case ( GRC ) filing, we did not record certain regulatory mechanisms in 2Q 2023 and YTD 6/30/23: Interim Rate Memorandum Account (IRMA)*: Tracks difference between interim rates and final rates authorized by California Public Utilities Commission (CPUC) in our 2021 GRC filing; our practice is to record IRMA balances as operating revenue when amounts are known and authorized for recovery after 2021 GRC decision Monterey - Style Water Revenue Adjustment Mechanism ( MWRAM )*: Tracks difference between sales revenue and modeled single - quantity rate revenue authorized by CPUC; our practice is to record MWRAM balances as operating revenue when amounts are known and authorized for recovery after 2021 GRC decision Drought Response Memorandum Account ( DREMA )*: Tracks reduced sales revenues when customer demand is affected by requests for voluntary or mandatory usage reductions; our practice is to file advice letter to authorize recovery of DREMA balances as operating revenue when amounts are known and authorized for recovery after 2021 GRC decision *2021 GRC regulatory mechanism transactions are retroactive to 1/1/23

INVESTOR RELATIONS Based on current positions of parties to 2021 GRC filing, we estimated understatement of operating revenue during 2Q 2023 to be in $ 19M – $ 29M range ($0.28 to $0.43 EPS)*: Unrecorded California Regulatory M echanisms in Q2 2023 8 *IRMA value will depend on final 2021 GRC rates authorized for recovery. MWRAM was requested in 2021 GRC and was not disputed by any other party to the proceeding; its value will depend on final 2021 GRC rates. DREMA is an authorized memorandum account, and its value will depend on final 2021 GRC rates. Ranges are current estimates based on available information and may change as 2021 GRC progresses. Due to mechanism’s connection to customer billings, second quarter estimates are not necessarily indicative of potential impacts in future quarters. 2023 IRMA operating revenue range $ 11M to $ 20M ($0.16 to $0.29 EPS)* 2023 MWRAM operating revenue range $ 6M for both high & low ($0.09 EPS)* 2023 DREMA operating revenue range $ 2M to $3M ($0.03 to $0.05 EPS)* Estimated impact to EPS reflects the estimated impact to operating revenue, multiplied by 85% (which reflects an assumed effective corporate income tax rate of 15%), and divided by the diluted weighted average common shares outstanding during the period .
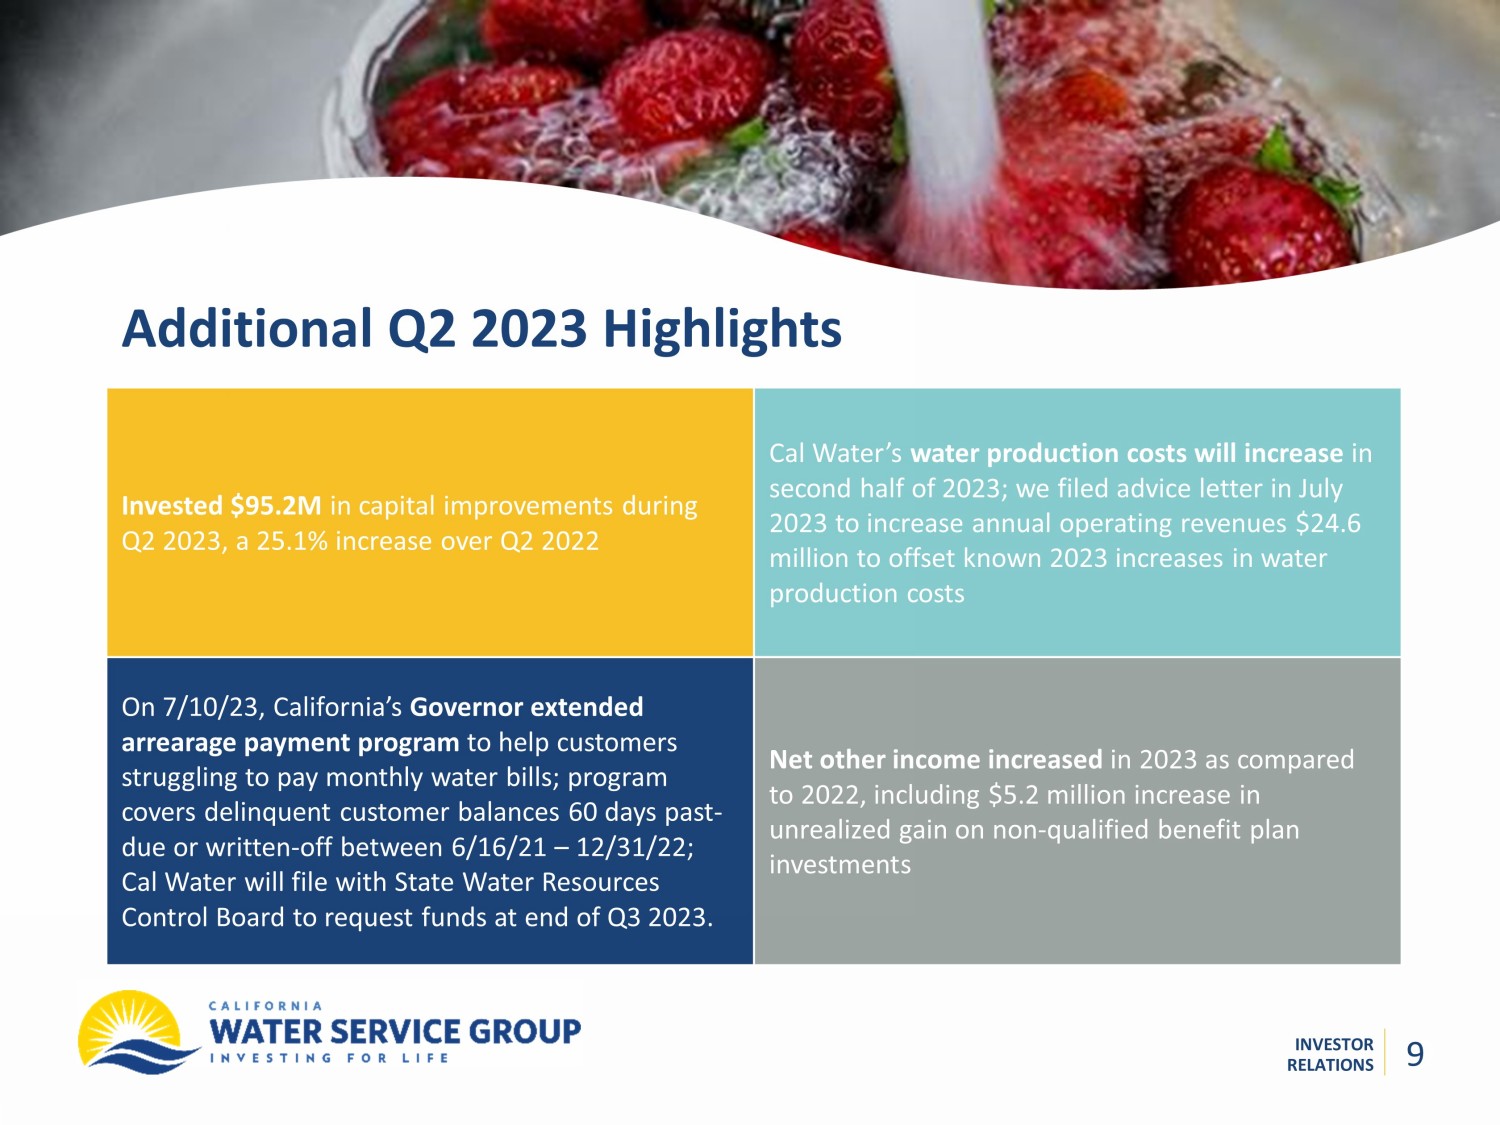
INVESTOR RELATIONS Additional Q 2 2023 Highlights 9 9 Invested $ 95.2M in capital improvements during Q2 2023, a 25.1% increase over Q2 2022 Cal Water’s water production costs will increase in second half of 2023; we filed advice letter in July 2023 to increase annual operating revenues $24.6 million to offset known 2023 increases in water production costs On 7/10/23, California’s Governor extended arrearage payment program to help customers struggling to pay monthly water bills; program covers delinquent customer balances 60 days past - due or written - off between 6/16/21 – 12/31/22; Cal Water will file with State Water Resources Control Board to request funds at end of Q3 2023. Net other income increased in 2023 as compared to 2022, including $5.2 million increase in unrealized gain on non - qualified benefit plan investments
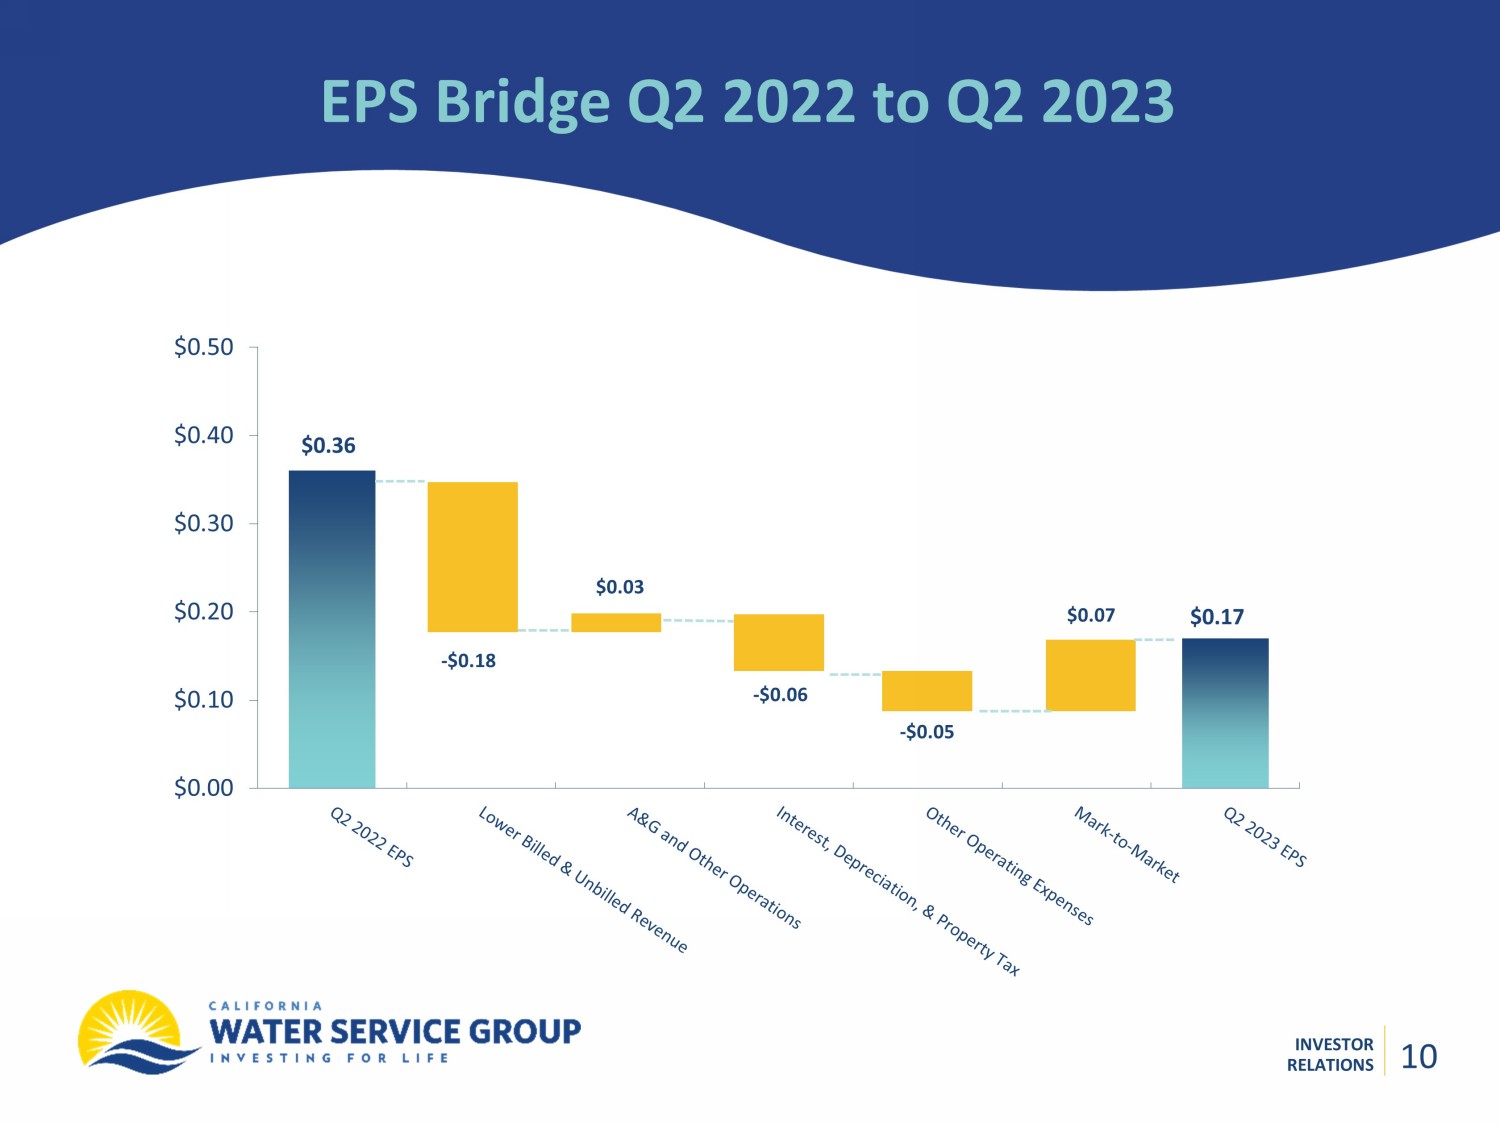
INVESTOR RELATIONS EPS Bridge Q2 2022 to Q2 2023 $0.00 $0.10 $0.20 $0.30 $0.40 $0.50 $0.07 - $0.06 $0.36 $0.03 - $0.18 $0.17 - $0.05 10
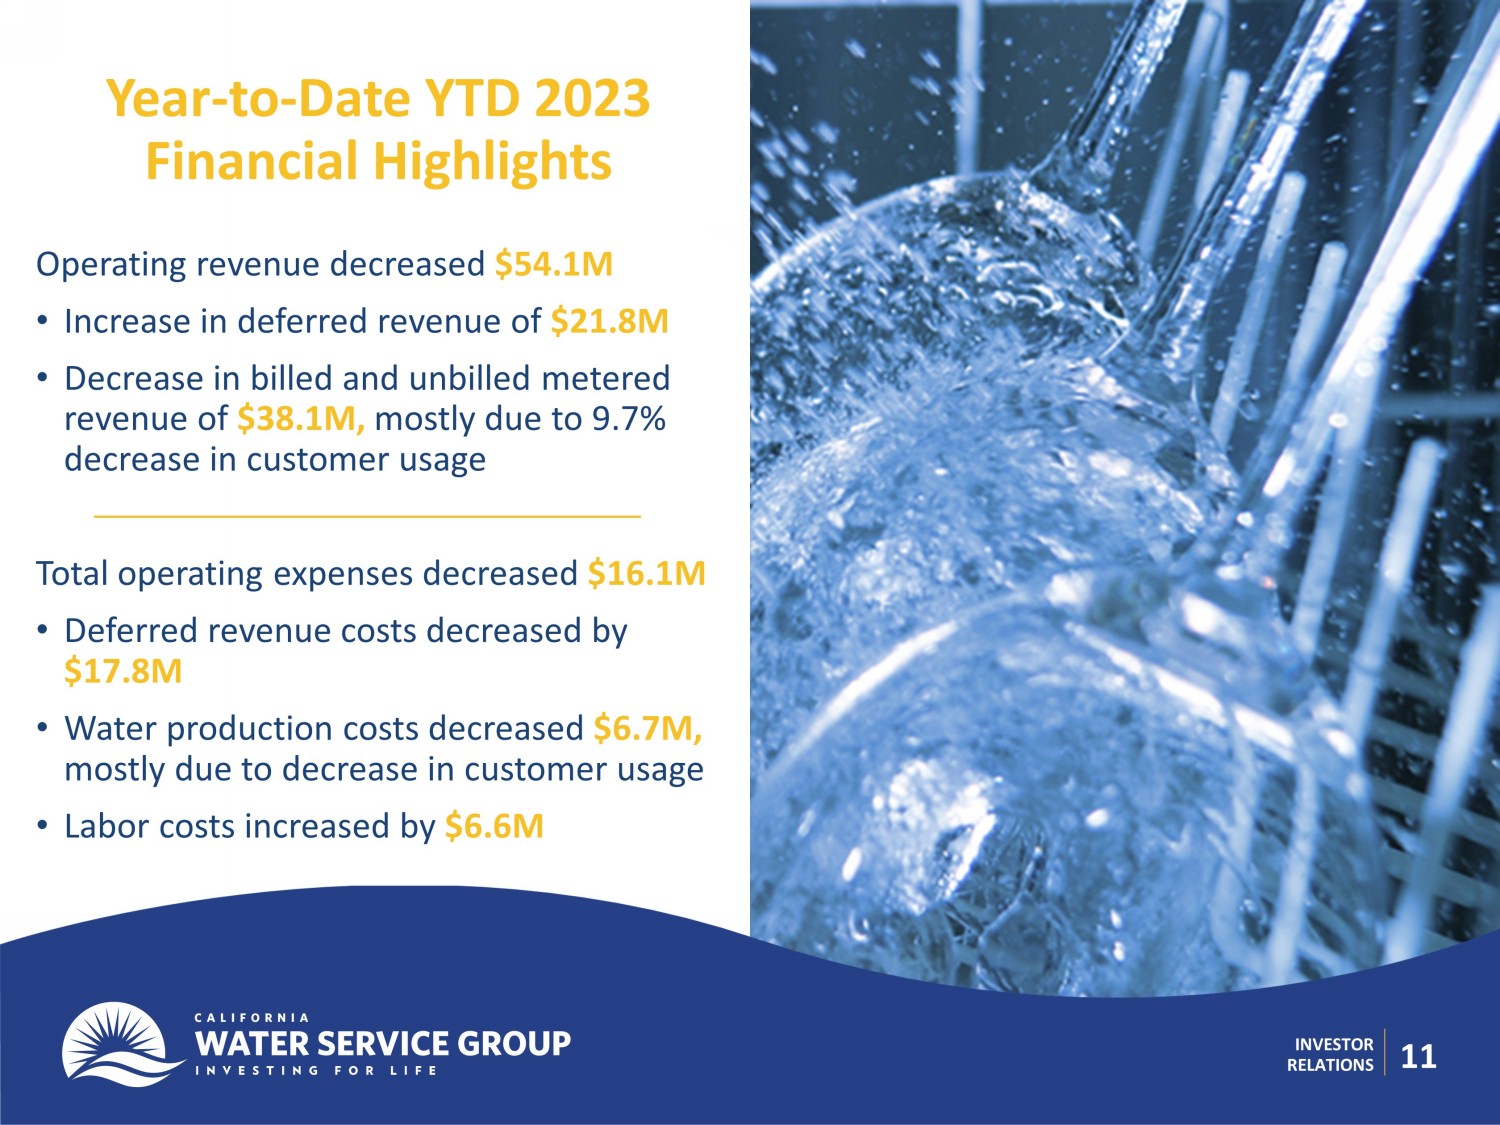
INVESTOR RELATIONS 11 Year - to - Date YTD 2023 Financial Highlights Operating revenue decreased $ 54.1M • Increase in deferred revenue of $ 21.8M • Decrease in billed and unbilled metered revenue of $38.1M, mostly due to 9.7% decrease in customer usage Total operating expenses decreased $16.1M • Deferred revenue costs decreased by $17.8M • Water production costs decreased $6.7M, mostly due to decrease in customer usage • Labor costs increased by $6.6M
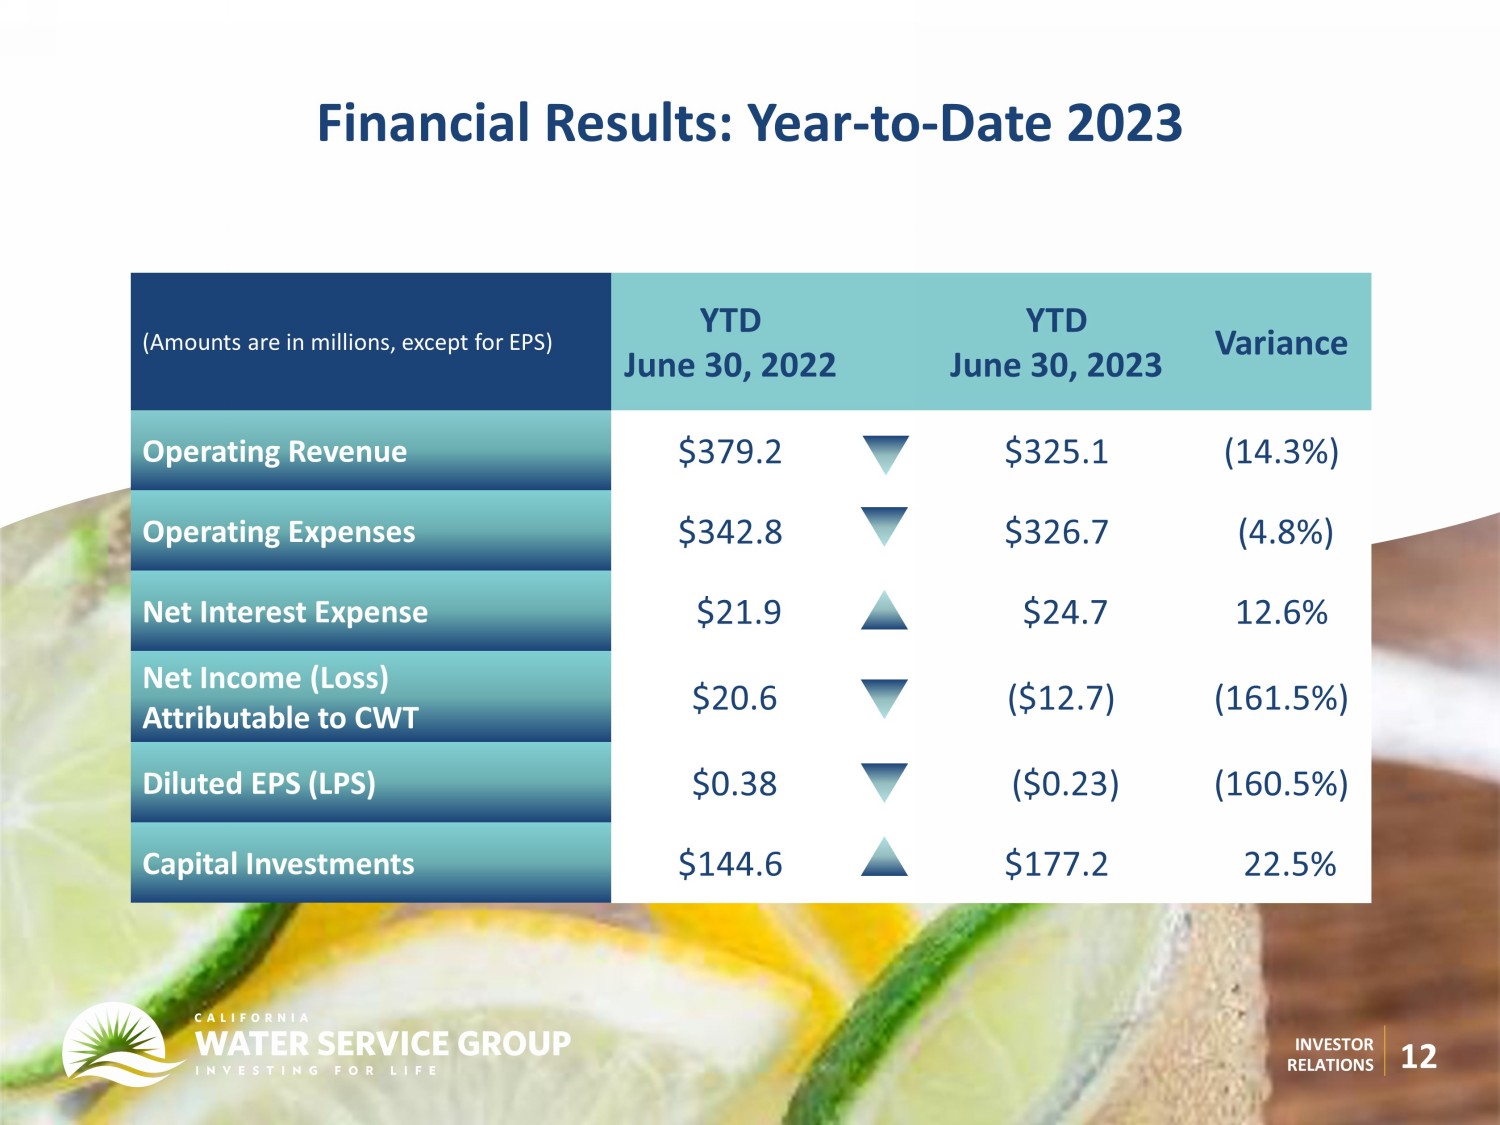
INVESTOR RELATIONS 12 (Amounts are in millions, except for EPS) YTD June 30, 2022 YTD June 30, 2023 Variance Operating Revenue $379.2 $325.1 (14.3%) Operating Expenses $342.8 $326.7 (4.8%) Net Interest Expense $21.9 $24.7 12.6% Net In come (Loss) Attributable to CWT $20.6 ($12.7) (161.5%) Diluted EPS (LPS) $0.38 ($0.23) (160.5%) Capital Investments $144.6 $177.2 22.5% Financial Results: Year - to - Date 2023
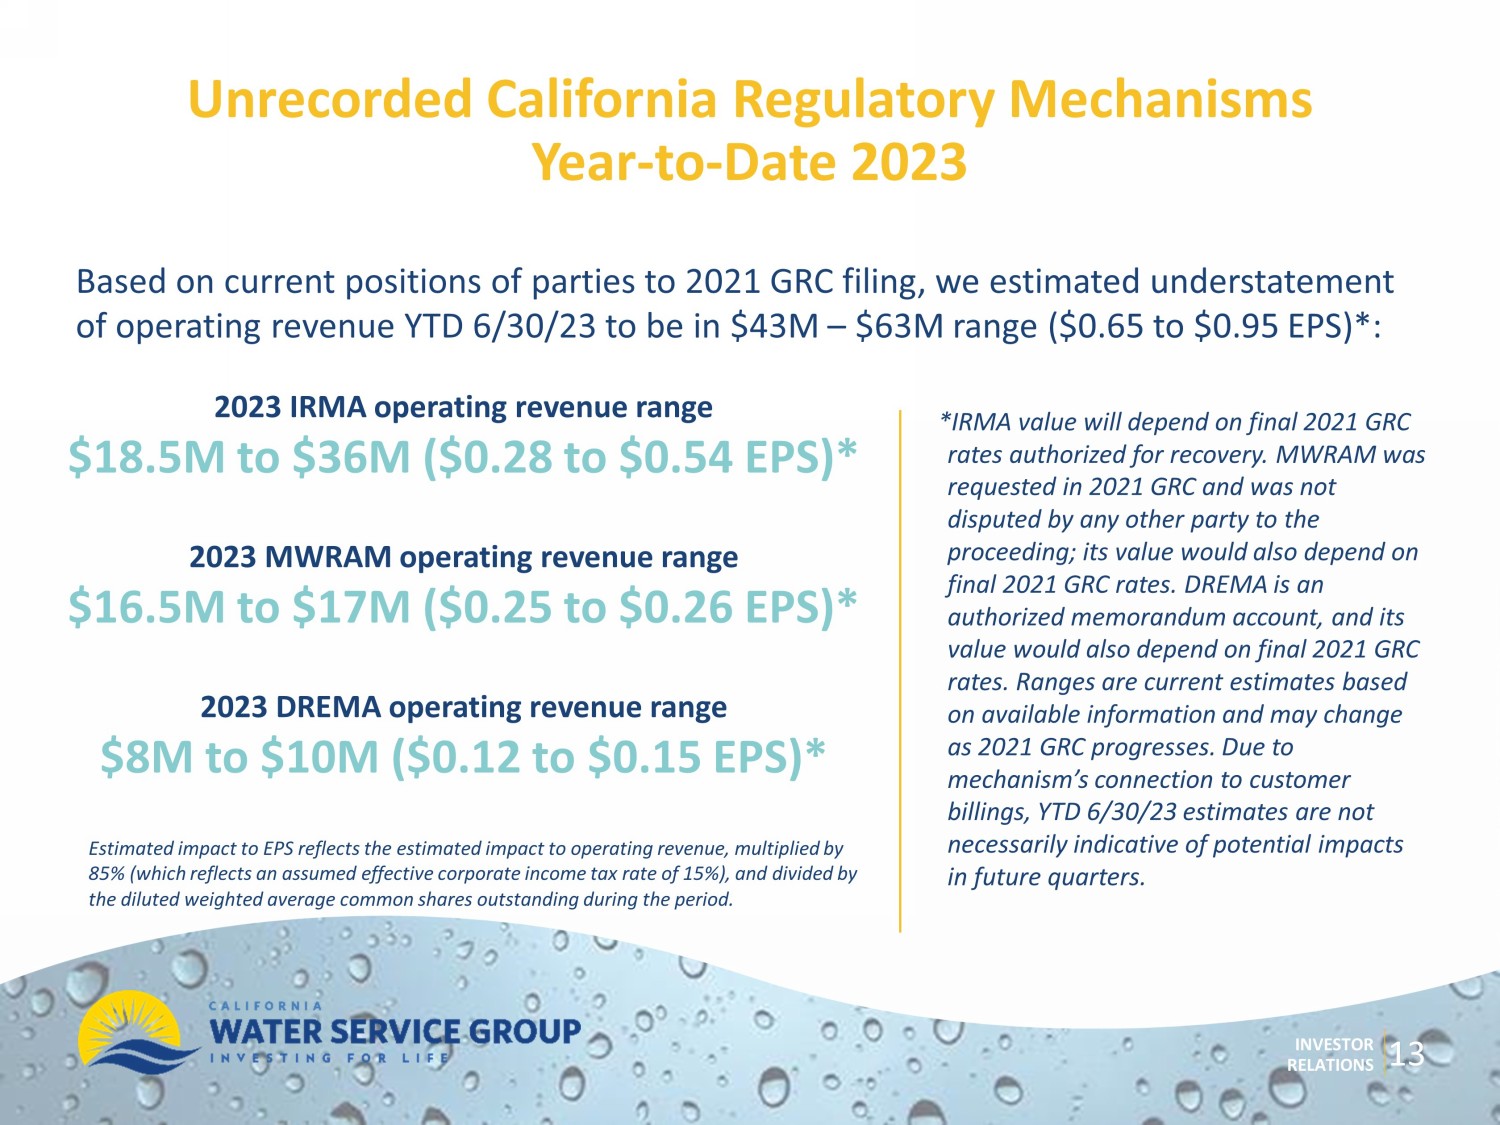
INVESTOR RELATIONS Based on current positions of parties to 2021 GRC filing, we estimated understatement of operating revenue YTD 6/30/23 to be in $ 43M – $ 63M range ($0.65 to $0.95 EPS)*: Unrecorded California Regulatory M echanisms Year - to - Date 2023 13 *IRMA value will depend on final 2021 GRC rates authorized for recovery. MWRAM was requested in 2021 GRC and was not disputed by any other party to the proceeding; its value would also depend on final 2021 GRC rates. DREMA is an authorized memorandum account, and its value would also depend on final 2021 GRC rates. Ranges are current estimates based on available information and may change as 2021 GRC progresses. Due to mechanism’s connection to customer billings, YTD 6/30/23 estimates are not necessarily indicative of potential impacts in future quarters. 2023 IRMA operating revenue range $ 18.5M to $ 36M ($0.28 to $0.54 EPS)* 2023 MWRAM operating revenue range $ 16.5M to $ 17M ($0.25 to $0.26 EPS)* 2023 DREMA operating revenue range $ 8M to $ 10M ($0.12 to $0.15 EPS)* Estimated impact to EPS reflects the estimated impact to operating revenue, multiplied by 85% (which reflects an assumed effective corporate income tax rate of 15%), and divided by the diluted weighted average common shares outstanding during the period .
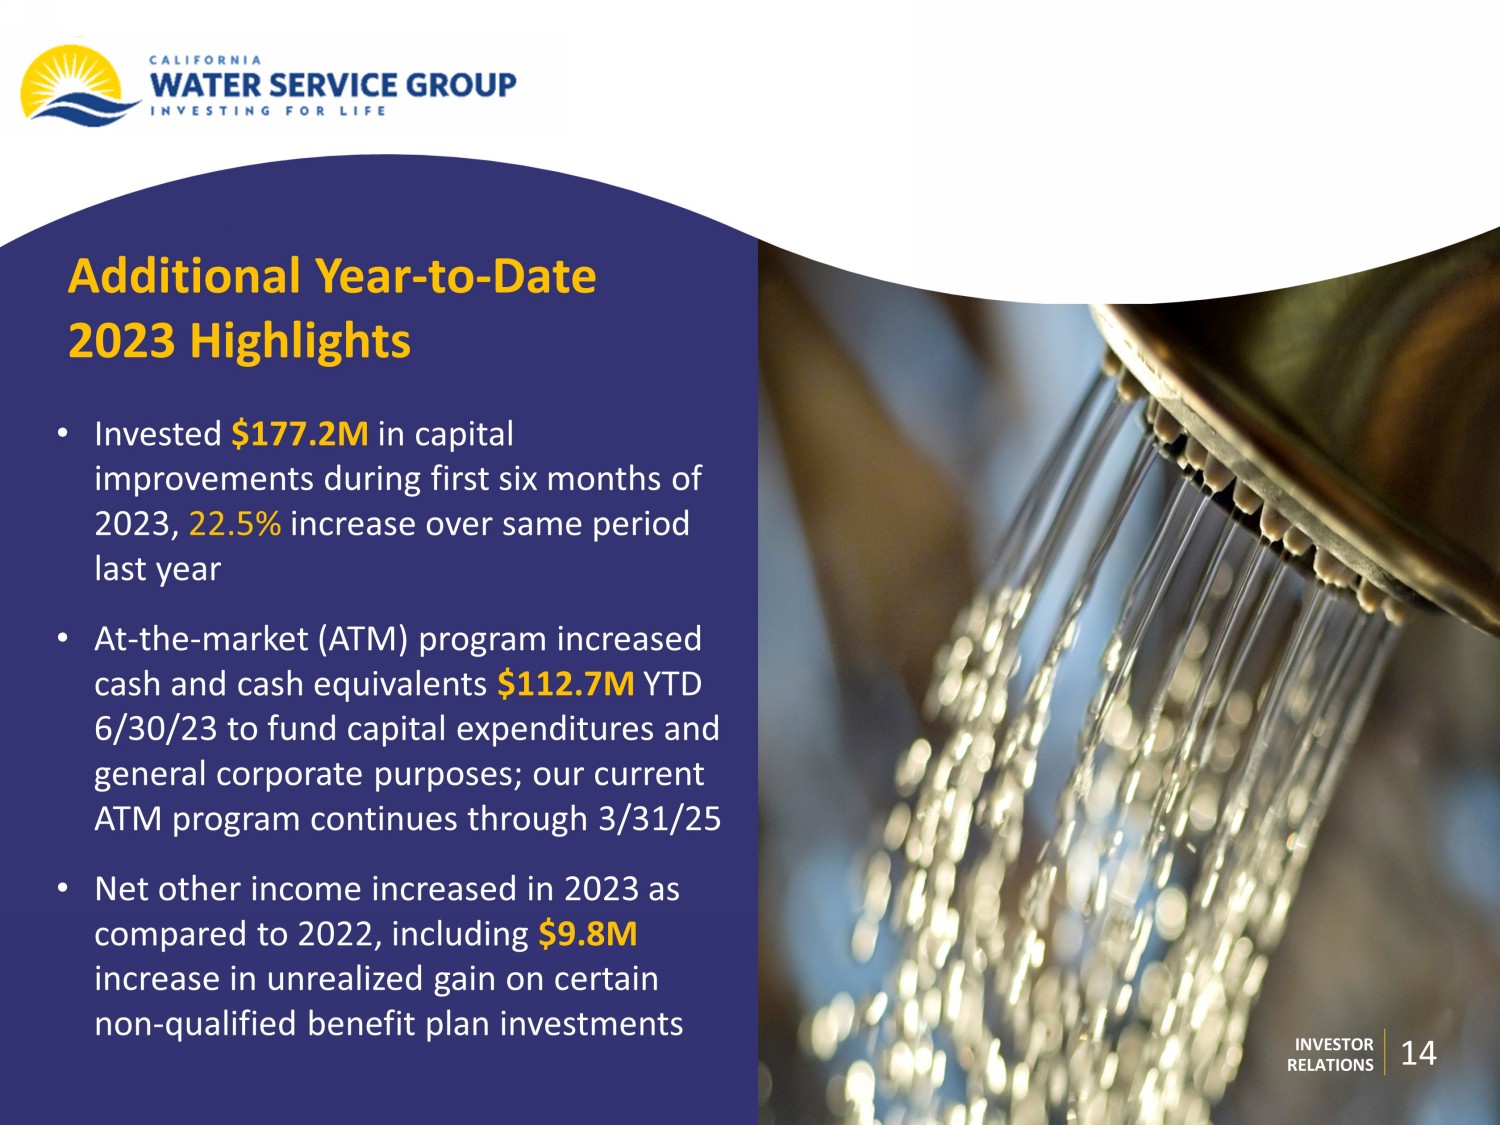
Additional Year - to - Date 2023 Highlights • Invested $177.2M in capital improvements during first six months of 2023, 22.5% increase over same period last year • At - the - market (ATM) program increased cash and cash equivalents $ 112.7M YTD 6/30/23 to fund capital expenditures and general corporate purposes; our current ATM program continues through 3/31/25 • Net other income increased in 2023 as compared to 2022, including $ 9.8M increase in unrealized gain on certain non - qualified benefit plan investments 14 INVESTOR RELATIONS
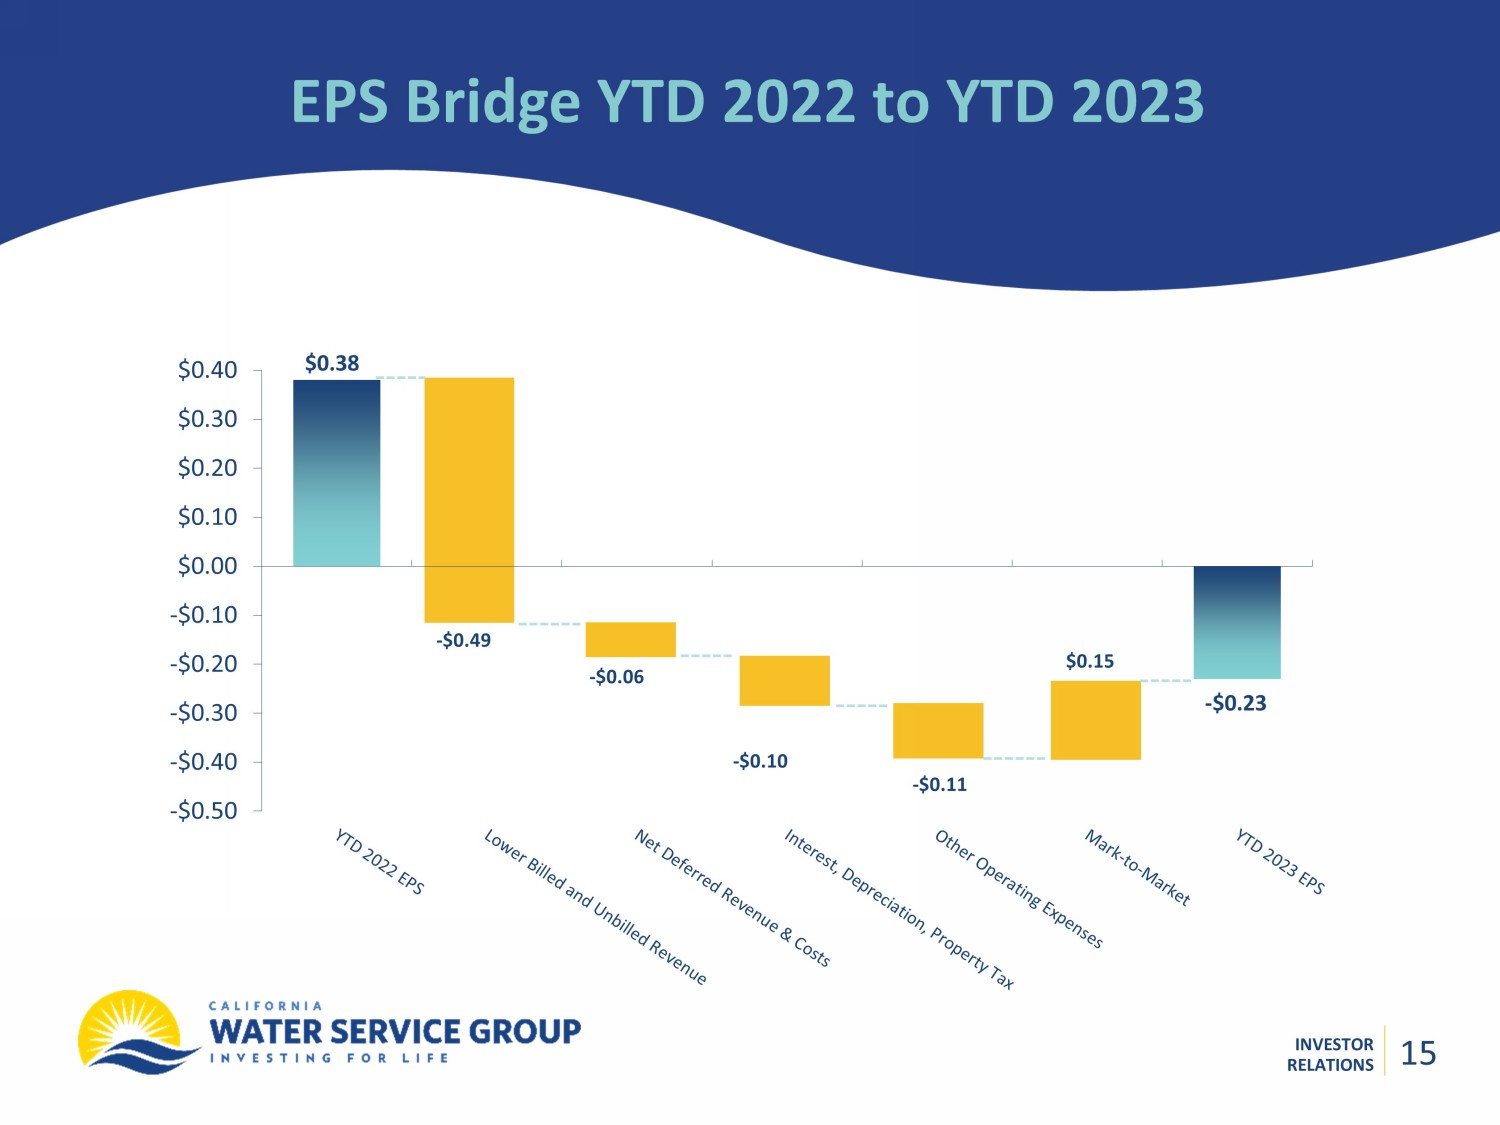
INVESTOR RELATIONS EPS Bridge YTD 2022 to YTD 2023 -$0.50 -$0.40 -$0.30 -$0.20 -$0.10 $0.00 $0.10 $0.20 $0.30 $0.40 $0.15 - $0.10 $0.38 - $0.06 - $0.49 - $0.23 - $0.11 15 15
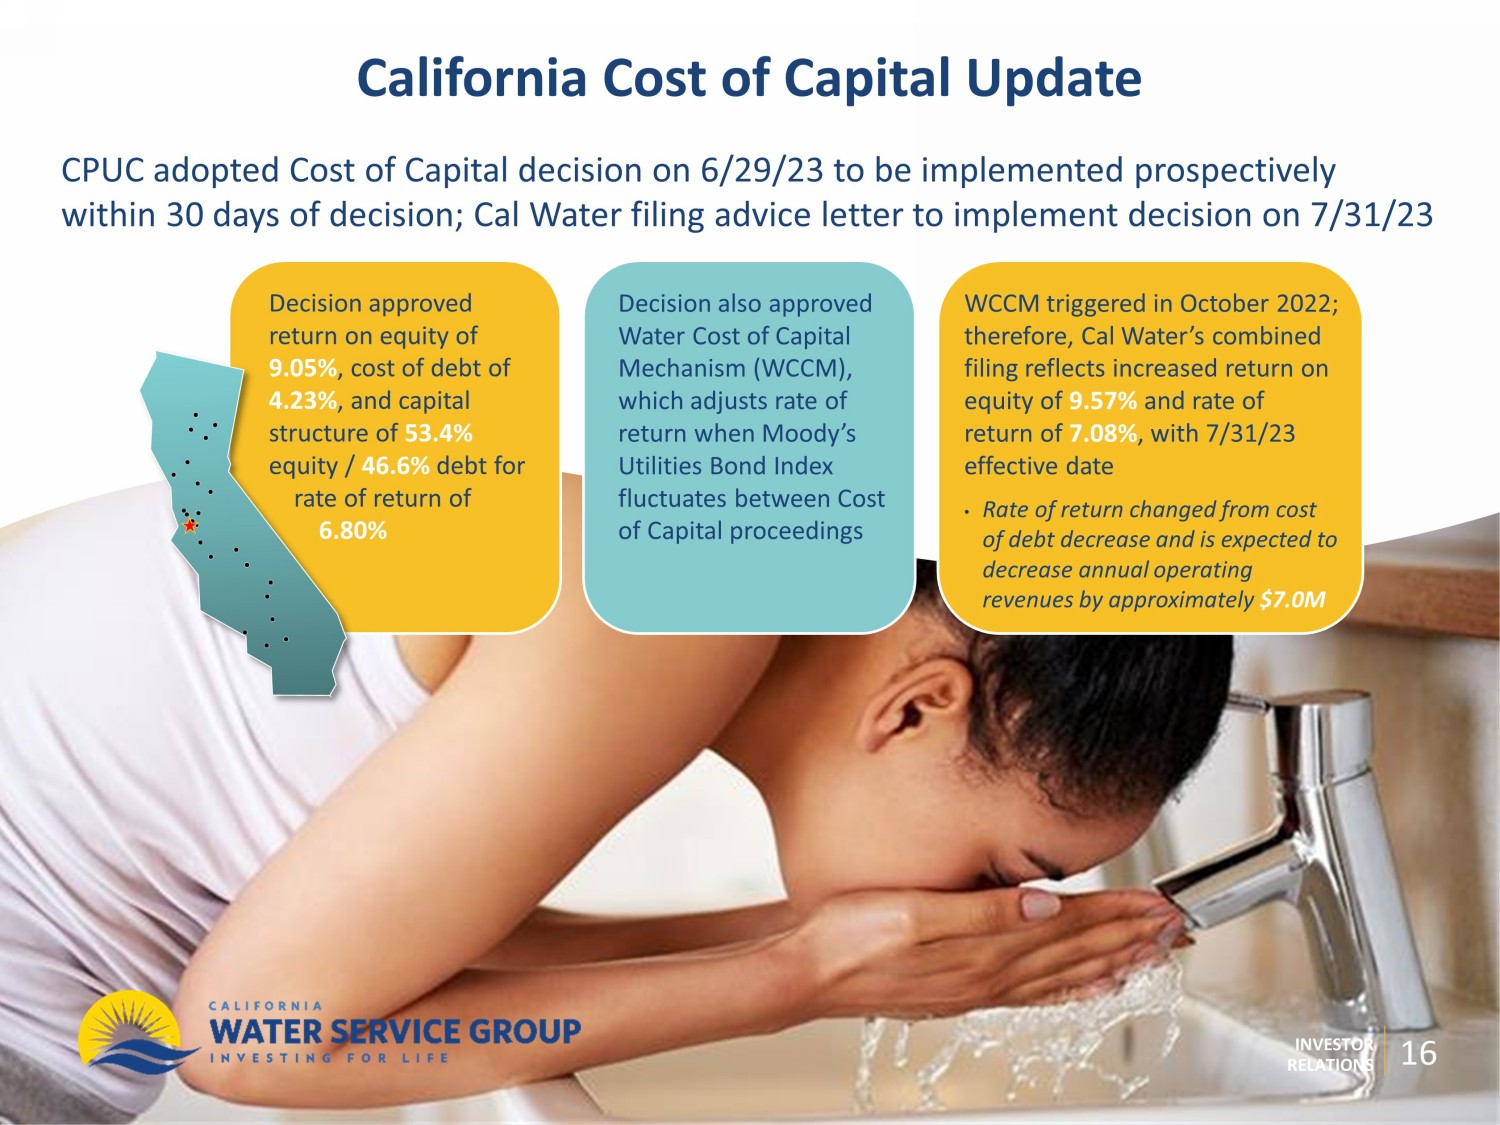
INVESTOR RELATIONS California Cost of Capital Update Decision approved return on equity of 9.05% , cost of debt of 4.23% , and capital structure of 53.4% equity / 46.6% debt for rate of return of 6.80% WCCM triggered in October 2022; therefore, Cal Water’s combined filing reflects increased return on equity of 9.57% and rate of return of 7.08% , with 7/31/23 effective date • Rate of return changed from cost of debt decrease and is expected to decrease annual operating revenues by approximately $ 7.0M Decision also approved Water Cost of Capital Mechanism (WCCM), which adjusts rate of return when Moody’s Utilities Bond Index fluctuates between Cost of Capital proceedings CPUC adopted Cost of Capital decision on 6/29/23 to be implemented prospectively within 30 days of decision; Cal Water filing advice letter to implement decision on 7/31/23 16
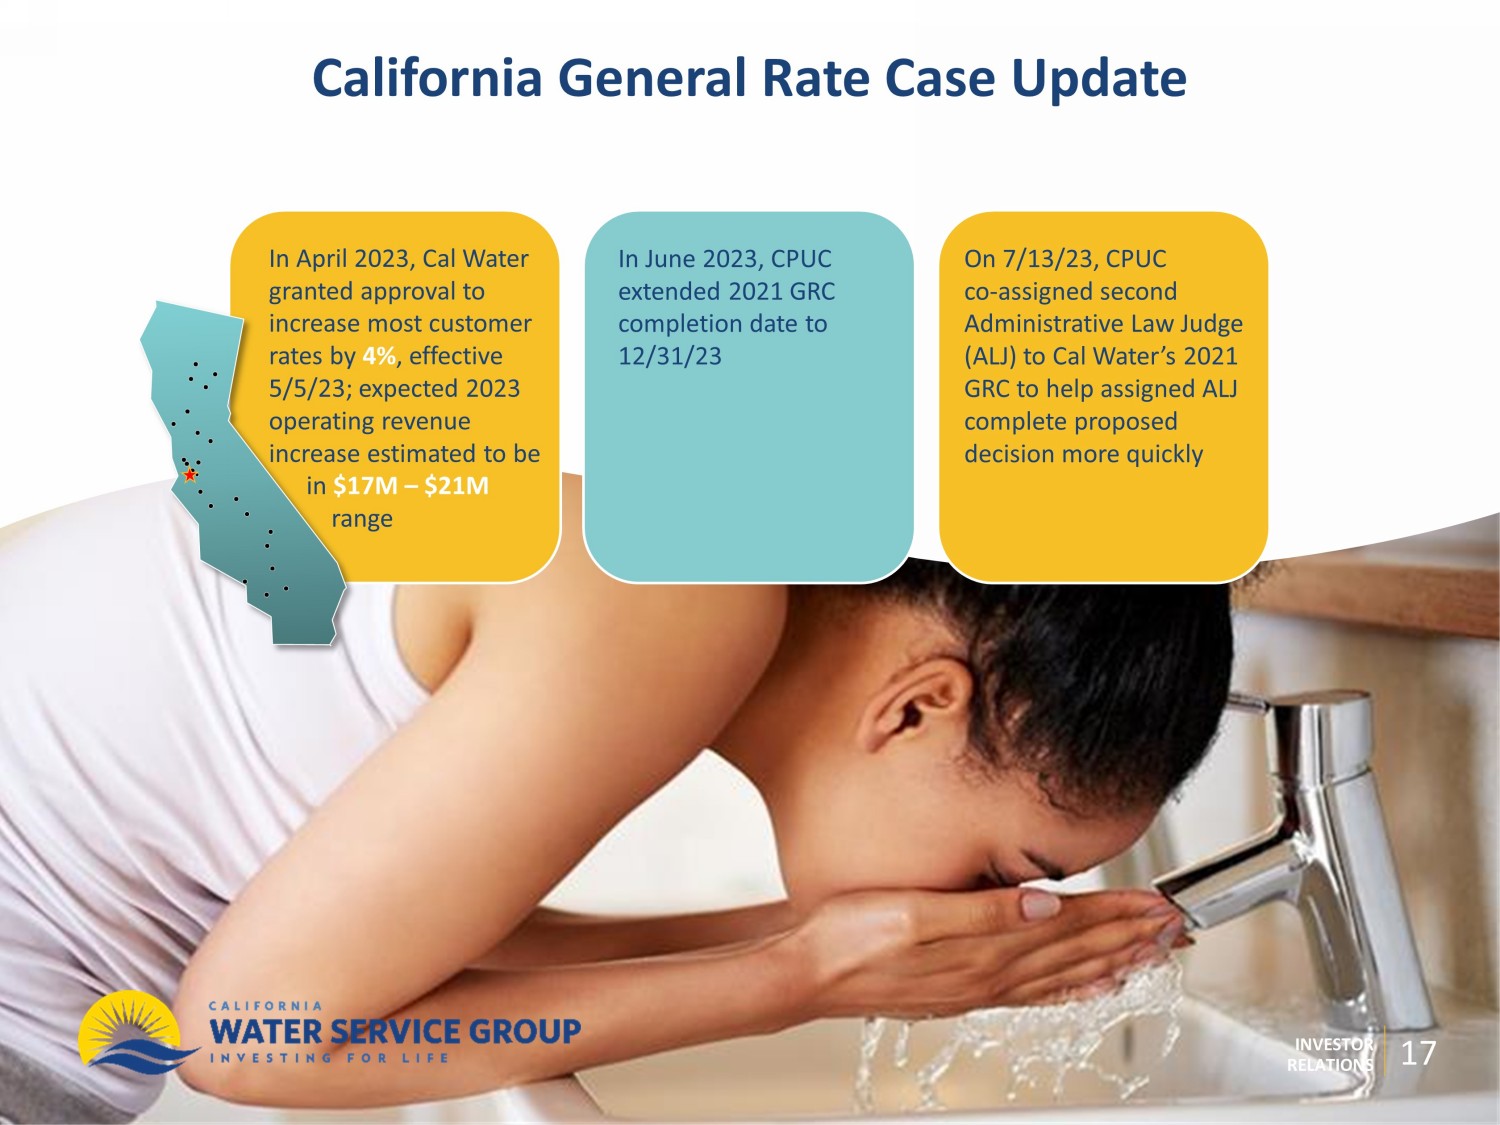
INVESTOR RELATIONS California General Rate Case Update In April 2023, Cal Water granted approval to increase most customer rates by 4% , effective 5/5/23; expected 2023 operating revenue increase estimated to be in $ 17M – $ 21M range On 7/13/23, CPUC co - assigned second Administrative Law Judge (ALJ) to Cal Water’s 2021 GRC to help assigned ALJ complete proposed decision more quickly In June 2023, CPUC extended 2021 GRC completion date to 12/31/23 17
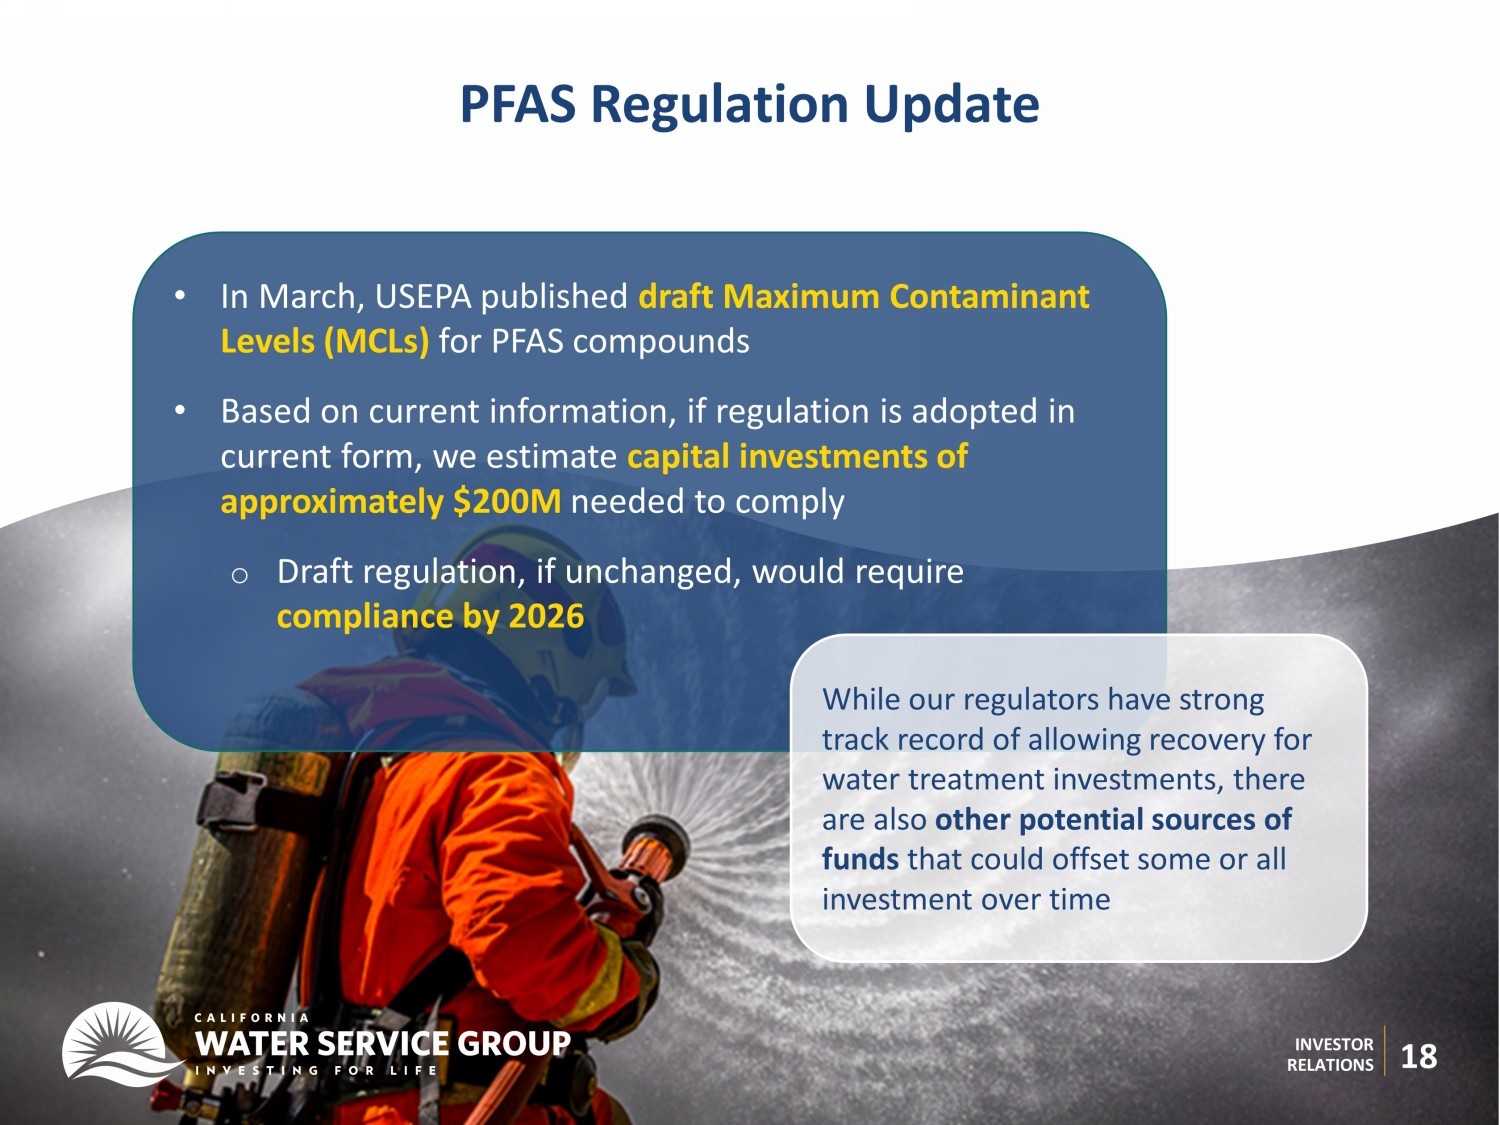
INVESTOR RELATIONS 18 PFAS Regulation Update • In March, USEPA published draft Maximum Contaminant Levels (MCLs) for PFAS compounds • Based on current information, if regulation is adopted in current form, we estimate capital investments of approximately $ 200M needed to comply o Draft regulation, if unchanged, would require compliance by 2026 While our regulators have strong track record of allowing recovery for water treatment investments, there are also other potential sources of funds that could offset some or all investment over time
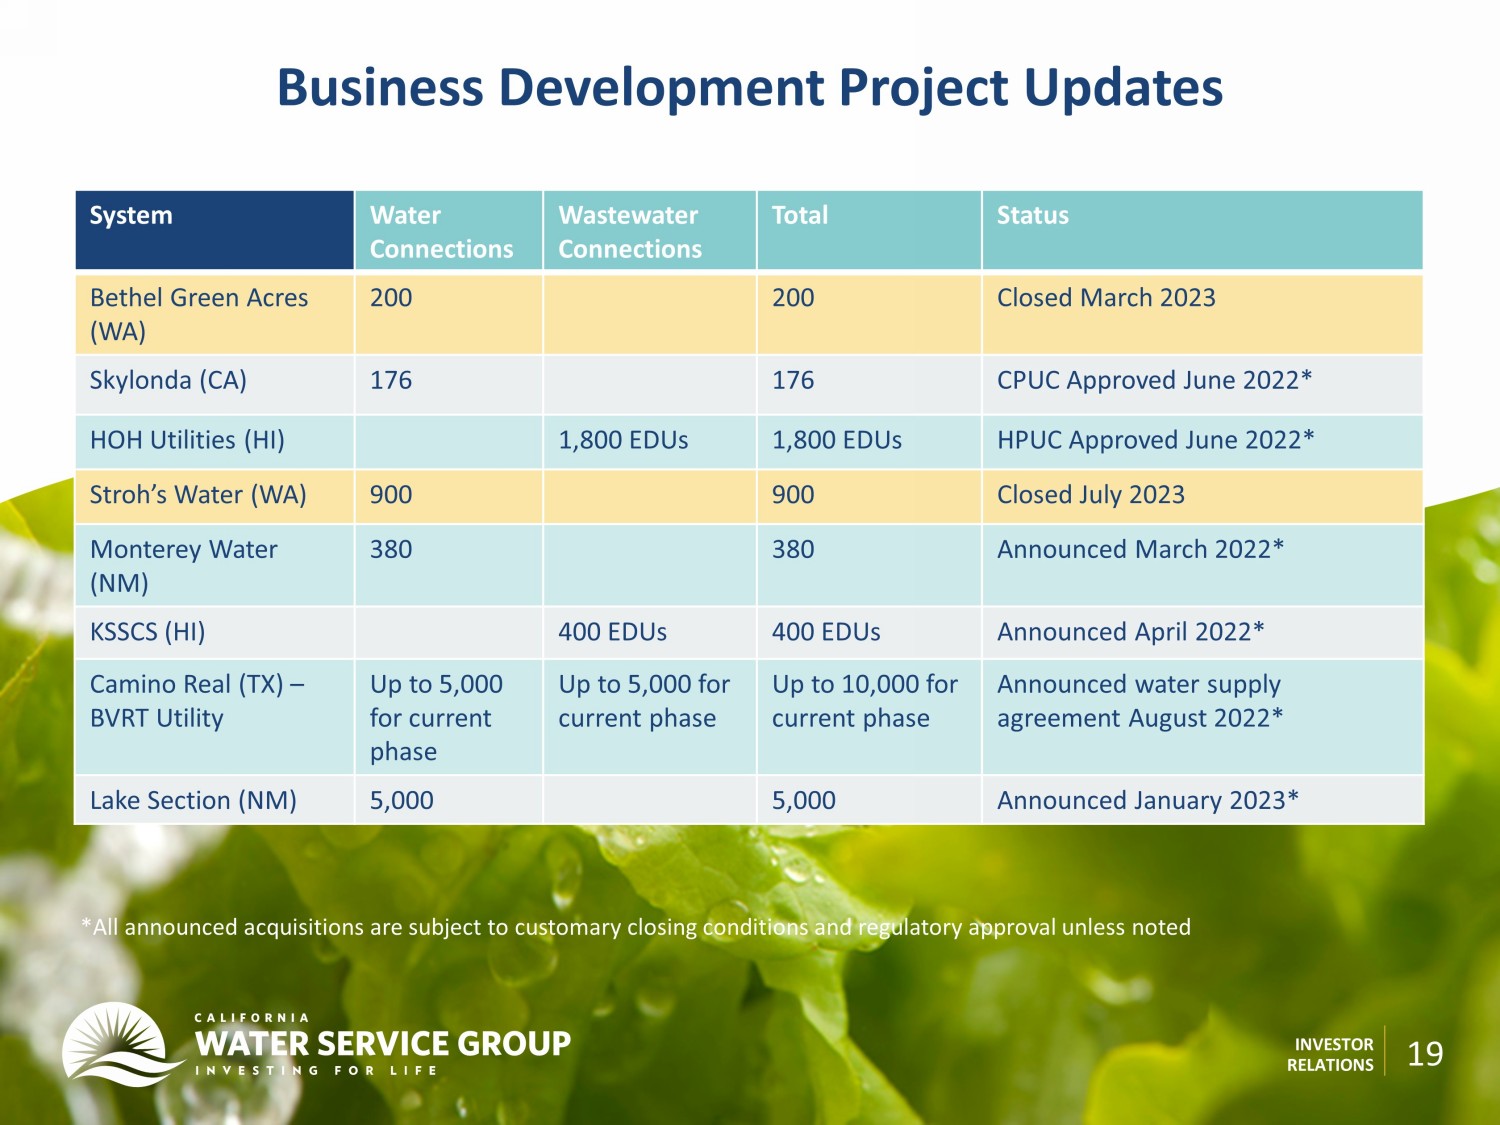
INVESTOR RELATIONS Business Development Project Updates System Water Connections Wastewater Connections Total Status Bethel Green Acres (WA) 200 200 Closed March 2023 Skylonda (CA) 176 176 CPUC Approved June 2022* HOH Utilities (HI) 1,800 EDUs 1,800 EDUs HPUC Approved June 2022 * Stroh’s Water (WA) 900 900 Closed July 2023 Monterey Water (NM) 380 380 Announced March 2022* KSSCS (HI) 400 EDUs 400 EDUs Announced April 2022* Camino Real (TX) – BVRT Utility Up to 5,000 for current phase Up to 5,000 for current phase Up to 10,000 for current phase Announced water supply agreement August 2022* Lake Section (NM) 5,000 5,000 Announced January 2023* *All announced acquisitions are subject to customary closing conditions and regulatory approval unless noted 19
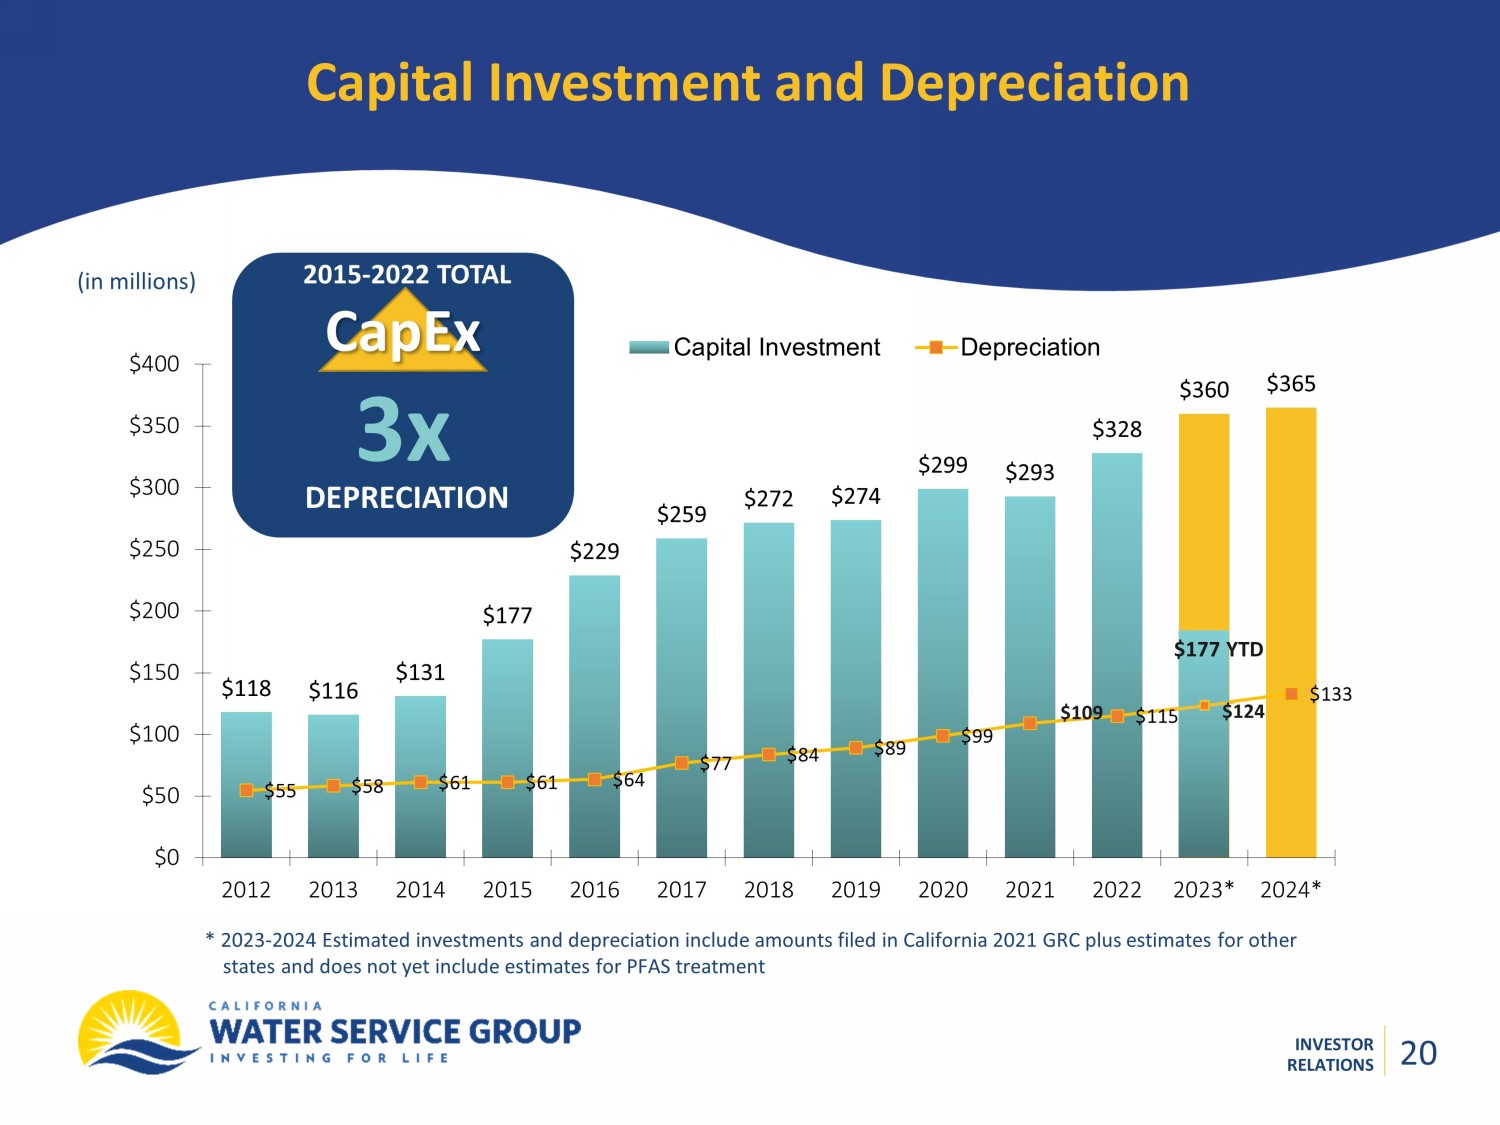
INVESTOR RELATIONS $118 $116 $131 $177 $229 $259 $272 $274 $299 $293 $328 $360 $365 $55 $58 $61 $61 $64 $77 $84 $89 $99 $115 $133 $0 $50 $100 $150 $200 $250 $300 $350 $400 2012 2013 2014 2015 2016 2017 2018 2019 2020 2021 2022 2023* 2024* Capital Investment Depreciation Capital Investment and Depreciation (in millions) * 2023 - 2024 Estimated investments and depreciation include amounts filed in California 2021 GRC plus estimates for other states and does not yet include estimates for PFAS treatment 2015 - 2022 TOTAL CapEx 3x DEPRECIATION $109 20 $177 YTD $124 20
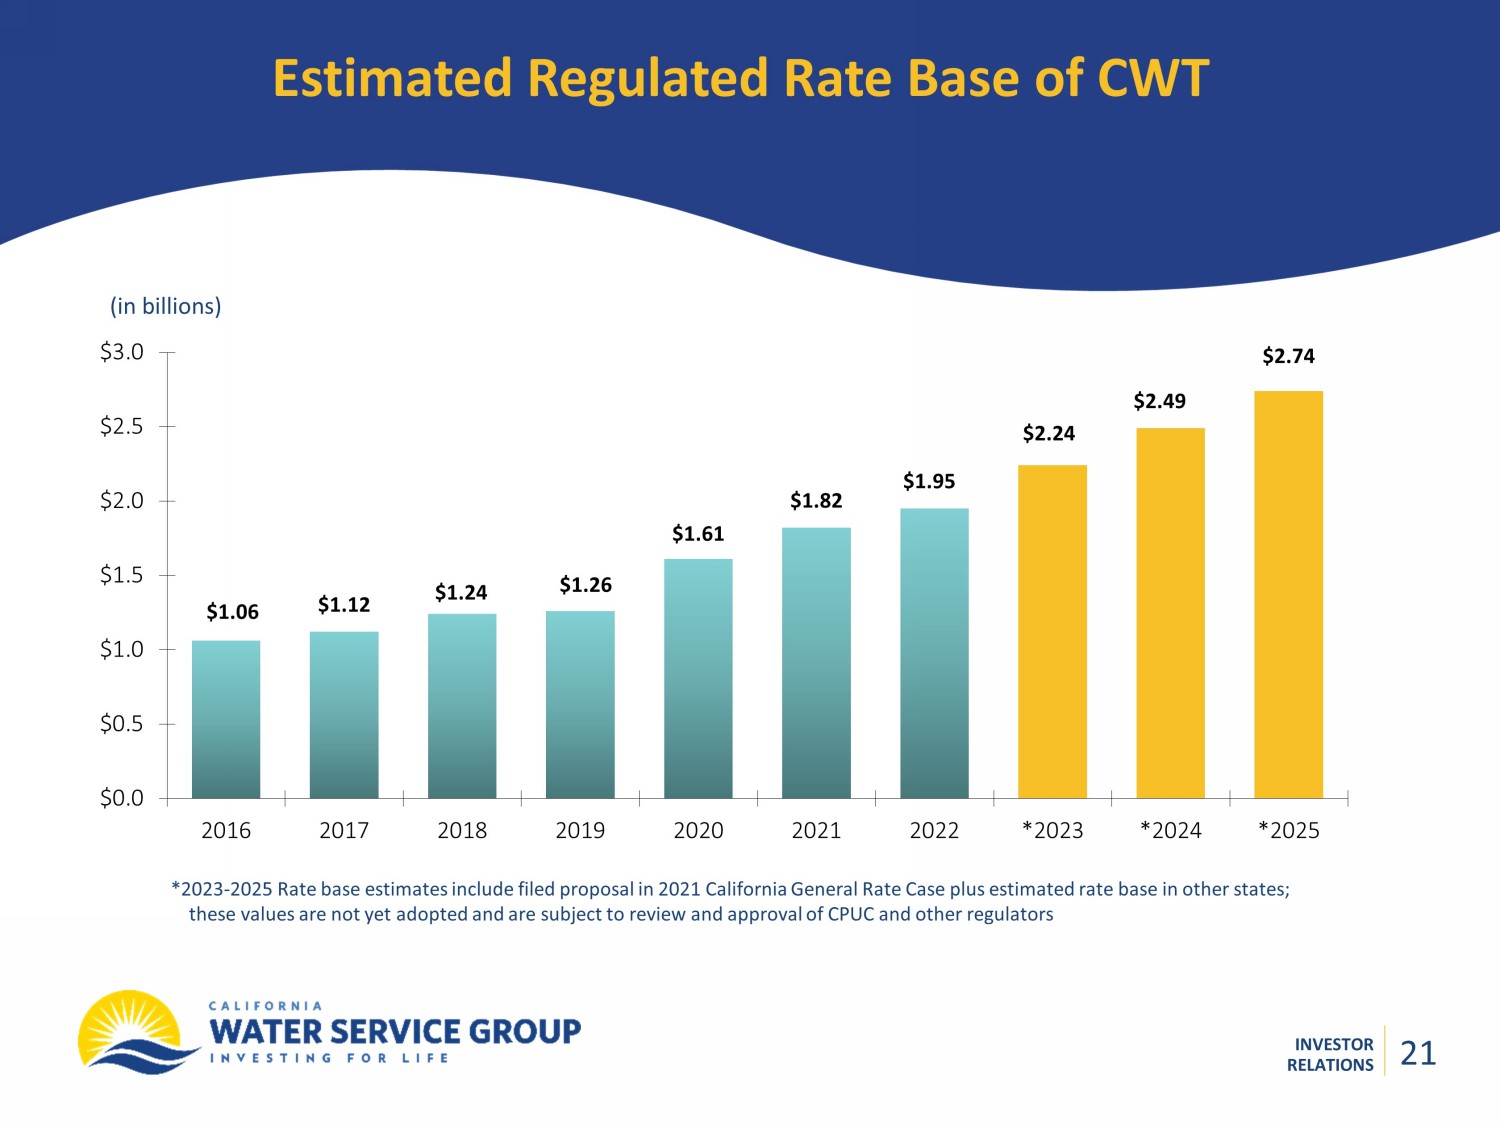
INVESTOR RELATIONS Estimated Regulated Rate Base of CWT (in billions) *2023 - 2025 Rate base estimates include filed proposal in 2021 California General Rate Case plus estimated rate base in other sta tes; these values are not yet adopted and are subject to review and approval of CPUC and other regulators $1.06 $1.12 $1.24 $1.61 $2.74 $1.26 $1.82 $0.0 $0.5 $1.0 $1.5 $2.0 $2.5 $3.0 2016 2017 2018 2019 2020 2021 2022 *2023 *2024 *2025 $1.95 $2.24 $2.49 21 21
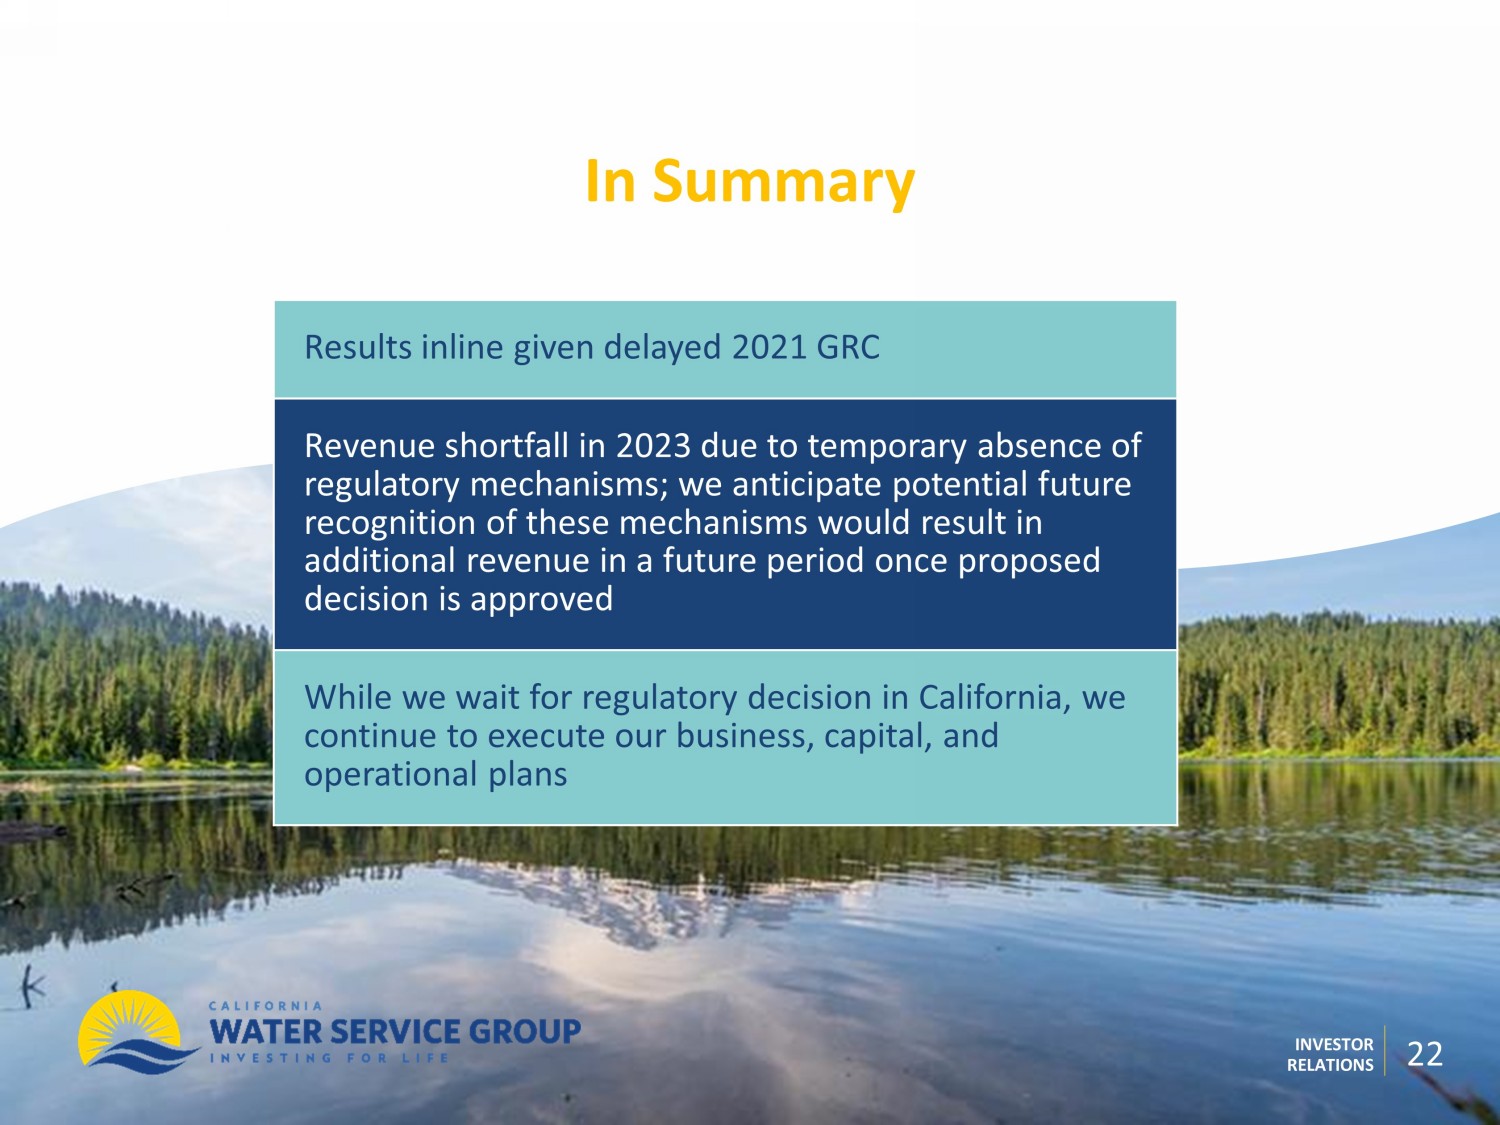
INVESTOR RELATIONS In Summary 22 Results inline given delayed 2021 GRC Revenue shortfall in 2023 due to temporary absence of regulatory mechanisms; we anticipate potential future recognition of these mechanisms would result in additional revenue in a future period once proposed decision is approved While we wait for regulatory decision in California, we continue to execute our business, capital, and operational plans

DISCUSSION