10-K: Annual report pursuant to Section 13 and 15(d)
Published on February 25, 2021
UNITED STATES
SECURITIES AND EXCHANGE COMMISSION
Washington, D.C. 20549
Form 10-K
For the fiscal year ended December 31 , 2020
OR
For the transition period from to
Commission file No. 1-13883
(Exact name of registrant as specified in its charter)
| (State or Other Jurisdiction of Incorporation or Organization) |
(I.R.S. Employer Identification No.) |
||||||||||
| (Address of Principal Executive Offices) | (Zip Code) | ||||||||||
(408 ) 367-8200
(Registrant's Telephone Number, including Area Code)
Securities registered pursuant to Section 12(b) of the Act:
| Title of Each Class: | Trading Symbol(s) | Name of Each Exchange on Which Registered: | ||||||||||||
Securities registered pursuant to Section 12(g) of the Act: None
Indicate by check mark if the registrant is a well-known seasoned issuer, as defined in Rule 405 of the Securities Act. Yes ☐ No ☒
Indicate by check mark if the registrant is not required to file reports pursuant to Section 13 of Section 15(d) of the Act. Yes ☐ No ☒
Indicate by check mark whether the registrant (1) has filed all reports required to be filed by Section 13 or 15(d) of the Securities Exchange Act of 1934 during the preceding 12 months (or for such shorter period that the Registrant was required to file such reports), and (2) has been subject to such filing requirements for the past 90 days. Yes ☒ No ☐
Indicate by check mark whether the registrant has submitted electronically every Interactive Data File required to be submitted pursuant to Rule 405 of Regulation S-T (§ 232,405 of this chapter) during the preceding 12 months (or for such shorter period that the registrant was required to submit such files). Yes ☒ No ☐
Indicate by check mark whether the registrant is a large accelerated filer, an accelerated filer, a non-accelerated filer, a smaller reporting company or an emerging growth company. See the definitions of "large accelerated filer," "accelerated filer," "smaller reporting company," and "emerging growth company" in Rule 12b-2 of the Exchange Act.
| ☒ | Accelerated filer | ☐ | |||||||||
| Non-accelerated filer | ☐ | Smaller reporting company | |||||||||
| Emerging growth company | |||||||||||
If an emerging growth company, indicate by check mark if the registrant has elected not to use the extended transition period for complying with any new or revised financial accounting standards provided pursuant to Section 13(a) of the Exchange Act. ☐
Indicate by check mark whether the registrant has filed a report on and attestation to its management’s assessment of the effectiveness of its internal control over financial reporting under Section 404(b) of the Sarbanes-Oxley Act (15 U.S.C.7262(b)) by the registered public accounting firm that prepared or issued its audit report. ☒
Indicate by check mark whether the registrant is a shell company (as defined in Rule 12b-2 of the Act). Yes ☐ No ☐
The aggregate market value of the voting and non-voting common stock held by non-affiliates of the registrant was $2,356 million on June 30, 2020, the last business day of the registrant's most recently completed second fiscal quarter. The valuation is based on the closing price of the registrant's common stock as traded on the New York Stock Exchange.
The Common stock outstanding at February 8, 2021 was 50,348,013 shares.
DOCUMENTS INCORPORATED BY REFERENCE
1
TABLE OF CONTENTS
| Page | ||||||||
2
| Page | ||||||||
3
PART I
Item 1. Business.
Forward-Looking Statements
This annual report, including all documents incorporated by reference, contains forward-looking statements within the meaning established by the Private Securities Litigation Reform Act of 1995. Forward-looking statements in this annual report are based on currently available information, expectations, estimates, assumptions and projections, and our management's beliefs, assumptions, judgments and expectations about us, the water utility industry and general economic conditions. These statements are not statements of historical fact. When used in our documents, statements that are not historical in nature, including words like "expects," "intends," "plans," "believes," "may," "estimates," "assumes," "anticipates," "projects," "predicts," "targets," "forecasts," "should," "could," "seeks," or variations of these words or similar expressions are intended to identify forward-looking statements. The forward-looking statements are not guarantees of future performance. They are based on numerous assumptions that we believe are reasonable, but they are open to a wide range of uncertainties and business risks. Consequently, actual results may vary materially from what is contained in a forward-looking statement.
Factors which may cause actual results to be different than those expected or anticipated include, but are not limited to:
•the impact of the ongoing COVID-19 pandemic and related public health measures;
•our ability to invest or apply the proceeds from the issuance of common stock in an accretive manner;
•governmental and regulatory commissions' decisions, including decisions on proper disposition of property;
•consequences of eminent domain actions relating to our water systems;
•changes in regulatory commissions' policies and procedures;
•the outcome and timeliness of regulatory commissions' actions concerning rate relief and other actions;
•increased risk of inverse condemnation losses as a result of climate conditions;
•our ability to renew leases to operate water systems owned by others on beneficial terms;
•changes in California State Water Resources Control Board water quality standards;
•changes in environmental compliance and water quality requirements;
•electric power interruptions, especially as a result of Public Safety Power Shutoff (PSPS) programs;
•housing and customer growth;
•the impact of opposition to rate increases;
•our ability to recover costs;
•availability of water supplies;
•issues with the implementation, maintenance or security of our information technology systems;
•civil disturbances or terrorist threats or acts;
•the adequacy of our efforts to mitigate physical and cyber security risks and threats;
•the ability of our enterprise risk management processes to identify or address risks adequately;
•labor relations matters as we negotiate with the unions;
•changes in customer water use patterns and the effects of conservation;
•our ability to complete, successfully integrate, and achieve anticipated benefits from announced acquisitions;
•the impact of weather, climate, natural disasters, and actual or threatened public health emergencies, including disease outbreaks, on our operations, water quality, water availability, water sales and operating results and the adequacy of our emergency preparedness;
4
•restrictive covenants in or changes to the credit ratings on our current or future debt that could increase our financing costs or affect our ability to borrow, make payments on debt or pay dividends; and
•the risks set forth in "Risk Factors" included elsewhere in this annual report.
In light of these risks, uncertainties and assumptions, investors are cautioned not to place undue reliance on forward-looking statements, which speak only as of the date of this annual report or as of the date of any document incorporated by reference in this annual report, as applicable. When considering forward-looking statements, investors should keep in mind the cautionary statements in this annual report and the documents incorporated by reference. We are not under any obligation, and we expressly disclaim any obligation, to update or alter any forward-looking statements, whether as a result of new information, future events or otherwise.
Overview
California Water Service Group is a holding company with six operating subsidiaries: California Water Service Company (Cal Water), New Mexico Water Service Company (New Mexico Water), Washington Water Service Company (Washington Water), Hawaii Water Service Company, Inc. (Hawaii Water), and CWS Utility Services and HWS Utility Services LLC (CWS Utility Services and HWS Utility Services LLC being referred to collectively in this annual report as Utility Services). Cal Water, New Mexico Water, Washington Water, and Hawaii Water are regulated public utilities. The regulated utility entities also provide some non-regulated services. Utility Services holds non-utility property and provides non-regulated services to private companies and municipalities outside of California. Cal Water was the original operating company and began operations in 1926.
Our business is conducted through our operating subsidiaries and we provide utility services to approximately two million people. The bulk of the business consists of the production, purchase, storage, treatment, testing, distribution and sale of water for domestic, industrial, public and irrigation uses, and for fire protection. In some areas, we provide wastewater collection and treatment services, including treatment which allows water recycling. We also provide non-regulated water-related services under agreements with municipalities and other private companies. The non-regulated services include full water system operation, billing and meter reading services. Non-regulated operations also include the lease of communication antenna sites, lab services and promotion of other non-regulated services.
During the year ended December 31, 2020, there were no significant changes in the kind of products produced or services rendered by our operating subsidiaries, or in the markets or methods of distribution.
Our mailing address and contact information is:
California Water Service Group
1720 North First Street
San Jose, California 95112-4598
Telephone number: 408-367-8200
www.calwatergroup.com
Annual reports on Form 10-K, quarterly reports on Form 10-Q, current reports on Form 8-K and amendments to these reports are available free of charge through our website at www.calwatergroup.com. The reports are available on our website as soon as reasonably practicable after such reports are filed with the SEC.
The content on any website referred to in this annual report is not incorporated by reference in this annual report unless expressly noted.
Regulated Business
California water operations are conducted by Cal Water, which provides service to approximately 492,600 customer connections in approximately 100 California communities through 21 separate districts, which are subject to regulation by the California Public Utilities Commission (CPUC). California water operations accounted for approximately 90.7% of our total customer connections and 93.8% of our total consolidated operating revenue.
We operate the City of Hawthorne and the City of Commerce water systems under lease agreements. In accordance with the lease agreements, we receive all revenues from operating the systems and are responsible for paying the operating costs. The City of Hawthorne and the City of Commerce lease revenues are governed through their respective city councils and are considered non-regulated because they are outside of the CPUC's jurisdiction. We report revenue and expenses for the City of Hawthorne and City of Commerce leases in operating revenue and operating expenses because we are entitled to retain all customer billings and are responsible for all operating expenses. These leases are considered "nontariffed products and services" (NTPS) by the CPUC and require a 10% revenue sharing with regulated customers.
5
In October of 2011, an agreement was negotiated with the City of Hawthorne to lease and operate its water system. The system, which is located near the Hermosa Redondo district, serves about half of Hawthorne's population. The capital lease agreement required an up-front $8.1 million lease deposit to the city that is being amortized over the lease term. Additionally, annual lease payments will be adjusted based on changes in rates charged to customers. Under the lease, we are responsible for all aspects of system operation and capital improvements, although title to the system and system improvements reside with the city. Capital improvements are recorded as depreciable plant and equipment and depreciated per the asset lives set forth in the agreement. In exchange, we receive all revenue from the water system, which was $10.5 million, $9.5 million and $10.1 million in 2020, 2019, and 2018, respectively. At the end of the lease, the city is required to reimburse us for the unamortized value of capital improvements made during the term of the lease. The City of Hawthorne capital lease is a 15-year lease and expires in 2026.
In April of 2018, a renewal agreement was negotiated with the City of Commerce for us to continue to lease and to operate its water system for 15 years. Under the agreement, the operating lease requires us to pay $0.8 million per year in monthly installments. We have operated the City of Commerce water system since 1985 and are responsible for all operations, maintenance, water quality assurance, customer service programs, and financing capital improvements to provide a reliable supply of water that meets federal and state standards to customers served by the City of Commerce system. The City of Commerce will retain title to the system and system improvements and remain responsible for setting its customers’ water rates. We bear the risks of operation and collection of amounts billed to customers. In exchange, we receive all revenue from the water system, which was $2.9 million, $2.9 million, and $3.0 million in 2020, 2019, and 2018, respectively. The agreement allows us to request a rate change annually in order to recover costs.
Hawaii Water provides service to approximately 5,300 water and wastewater customer connections on the islands of Maui, Oahu, and Hawaii, including several large resorts and condominium complexes. Hawaii Water's regulated customer connections are subject to the jurisdiction of the Hawaii Public Utilities Commission (HPUC). Hawaii Water accounts for 1.0% of our total customer connections and approximately 3.3% of our total consolidated operating revenue.
Washington Water provides domestic water service to approximately 36,600 customer connections in the Tacoma, Olympia, Graham, Spanaway, Puyallup, and Gig Harbor areas. Washington Water's utility operations are regulated by the Washington Utilities and Transportation Commission. Washington Water accounts for approximately 6.7% of our total customer connections and approximately 2.3% of our total consolidated operating revenue.
New Mexico Water provides service to approximately 8,500 water and wastewater customer connections in the Belen, Los Lunas, Indian Hills, and Elephant Butte areas in New Mexico. New Mexico's regulated operations are subject to the jurisdiction of the New Mexico Public Regulation Commission. New Mexico Water accounts for approximately 1.6% of our total customer connections and 0.6% of our total consolidated operating revenue.
The state regulatory bodies governing our regulated operations are referred to as the Commissions in this annual report. Rates and operations for regulated customers are subject to the jurisdiction of the respective state's regulatory Commission. The Commissions require that water and wastewater rates for each regulated district be independently determined based on the cost of service, except in Washington, which has a statewide tariff. The Commissions are expected to authorize rates sufficient to recover normal operating expenses and allow the utility to earn a fair and reasonable return on invested capital.
We distribute and treat water and treat wastewater in accordance with accepted water utility methods. Where applicable, we hold franchises and permits in the cities and communities where we operate. The franchises and permits allow us to operate and maintain facilities in public streets and right-of-ways as necessary.
Non-Regulated Activities
Fees for non-regulated activities are based on contracts negotiated between the parties. Under our non-regulated contract arrangements, we operate municipally owned water systems and privately owned water and recycled water distribution systems, but are not responsible for all operating costs. Non-regulated revenue received from non-leased water system operations is generally determined on a fee-per-customer basis.
Non-regulated revenue and expenses consist primarily of the operation of water systems that are owned by other entities under lease agreements, leasing of communication antenna sites on our properties, billing of optional third-party insurance programs to our residential customers, and unrealized gains or losses on benefit plan investments.
6
Effective June 30, 2011, the CPUC adopted new rules related to the provision of non-regulated services using utility assets and employees. As a result, nearly all California non-regulated activities are now considered NTPS. The prescribed accounting for these NTPS is incremental cost allocation plus revenue sharing with regulated customers. Non-regulated services determined to be "active activities" require a 10% revenue sharing, and "passive activities" require a 30% revenue sharing. The amount of non-regulated revenues subject to revenue sharing is the total billed revenues less any authorized pass-through costs. Some examples of CPUC authorized pass-through costs are purchased water, purchased power, and pump taxes. All of our non-regulated services, except for leasing communication antenna sites on our properties, are "active activities" subject to a 10% revenue sharing. Leasing communication antenna sites on our properties are "passive activities" subject to a 30% revenue sharing. Cal Water's annual revenue sharing with regulated customers was $2.5 million, $2.7 million, and $2.6 million in 2020, 2019, and 2018, respectively.
Operating Segment
We operate in one reportable segment, the supply and distribution of water and providing water-related utility services. For information about revenue from external customers, net income and total assets, see "Item 8. Financial Statements and Supplementary Data."
Growth
We intend to continue exploring opportunities to expand our regulated and non-regulated water and wastewater activities, particularly in the western United States. The opportunities could include system acquisitions, lease arrangements similar to the City of Hawthorne and City of Commerce contracts, full service system operation and maintenance agreements, meter reading, billing contracts and other utility-related services.
Geographical Service Areas and Number of Customer Connections at Year-end
Our principal markets are users of water within our service areas. The approximate number of customer connections served in each regulated district, the City of Hawthorne and the City of Commerce, at December 31 is as follows:
| (rounded to the nearest hundred) | 2020 | 2019 | |||||||||
| SAN FRANCISCO BAY AREA/NORTH COAST | |||||||||||
| Bay Area Region (serving South San Francisco, Colma, Broadmoor, San Mateo, San Carlos, Lucerne, Duncans Mills, Guerneville, Dillon Beach, Noel Heights and portions of Santa Rosa) | 56,000 | 55,900 | |||||||||
| Bear Gulch (serving portions of Menlo Park, Atherton, Woodside and Portola Valley) | 19,000 | 18,900 | |||||||||
| Los Altos (including portions of Cupertino, Los Altos Hills, Mountain View and Sunnyvale) | 19,000 | 19,000 | |||||||||
| Livermore | 18,900 | 18,900 | |||||||||
| 112,900 | 112,700 | ||||||||||
| SACRAMENTO VALLEY | |||||||||||
| Chico (including Hamilton City) | 30,800 | 30,500 | |||||||||
| Oroville | 3,700 | 3,600 | |||||||||
| Marysville | 3,800 | 3,800 | |||||||||
| Dixon | 3,100 | 3,000 | |||||||||
| Willows | 2,400 | 2,400 | |||||||||
| 43,800 | 43,300 | ||||||||||
| SALINAS VALLEY | |||||||||||
| Salinas Valley Region (including Salinas and King City) | 31,600 | 31,500 | |||||||||
| 31,600 | 31,500 | ||||||||||
| SAN JOAQUIN VALLEY | |||||||||||
| Bakersfield | 73,500 | 72,700 | |||||||||
| Stockton | 44,800 | 44,400 | |||||||||
| Visalia | 46,700 | 46,000 | |||||||||
| Selma | 6,500 | 6,500 | |||||||||
| Kern River Valley | 4,000 | 4,000 | |||||||||
7
| (rounded to the nearest hundred) | 2020 | 2019 | |||||||||
| 175,500 | 173,600 | ||||||||||
| LOS ANGELES AREA | |||||||||||
| East Los Angeles | 26,900 | 26,800 | |||||||||
| Hermosa Redondo (serving Hermosa Beach, Redondo Beach and a portion of Torrance) | 27,100 | 27,100 | |||||||||
| Dominguez (Carson and portions of Compton, Harbor City, Long Beach, Los Angeles and Torrance) | 34,300 | 34,200 | |||||||||
| Los Angeles County Region (including Palos Verdes Estates, Rancho Palos Verdes, Rolling Hills Estates, Rolling Hills, Fremont Valley, Lake Hughes, Lancaster and Leona Valley) | 25,700 | 25,700 | |||||||||
| Westlake (a portion of Thousand Oaks) | 7,100 | 7,100 | |||||||||
| Hawthorne and Commerce (leased municipal systems) | 7,700 | 7,600 | |||||||||
| 128,800 | 128,500 | ||||||||||
| CALIFORNIA TOTAL | 492,600 | 489,600 | |||||||||
| HAWAII | 5,300 | 5,000 | |||||||||
| NEW MEXICO | 8,500 | 8,300 | |||||||||
| WASHINGTON | 36,600 | 17,700 | |||||||||
| COMPANY TOTAL | 543,000 | 520,600 | |||||||||
Rates and Regulation
The Commissions have plenary powers setting both rates and operating standards. As such, the Commissions' decisions significantly impact the Company's revenues, earnings, and cash flows. The amounts discussed herein are generally annual amounts, unless otherwise stated, and the financial impact to recorded revenue is expected to occur over a 12-month period from the effective date of the decision. In California, water utilities are required to make several different types of filings. Certain filings, such as General Rate Case (GRC) filings, escalation rate increase filings, and offset filings, may result in rate changes that generally remain in place until the next GRC. As explained below, surcharges and surcredits to recover balancing and memorandum accounts as well as GRC interim rate relief are temporary rate changes which have specific time frames for recovery.
The CPUC follows a rate case plan which requires Cal Water to file a GRC for each of its regulated operating districts every three years. In a GRC proceeding the CPUC not only considers the utility's rate setting requests, but may also consider other issues that affect the utility's rates and operations. The CPUC is generally required to issue its GRC decision prior to the first day of the test year or authorize interim rates. In accordance with the rate case plan, Cal Water will file its next GRC application in July of 2021.
Between GRC filings, Cal Water may file escalation rate increases, which allow Cal Water to recover cost increases, primarily from inflation and incremental investments, during the second and third years of the rate case cycle. However, escalation rate increases are district specific and subject to an earnings test. The CPUC may reduce a district’s escalation rate increase if, in the most recent 13-month period, the earnings test reflects earnings in excess of what was authorized for that district.
In addition, California water utilities are entitled to make offset requests via advice letter. Offsets may be requested to adjust revenues for construction projects authorized in GRCs when those capital projects go into service (these filings are referred to as "rate base offsets"), or for rate changes charged to Cal Water for purchased water, purchased power, and pump taxes (which are referred to as "expense offsets"). Rate changes approved in offset requests remain in effect until the next GRC is approved.
8
In pursuit of the State of California's water conservation goals, the CPUC decoupled Cal Water's revenue requirement from customer consumption levels in 2008 by authorizing a Water Revenue Adjustment Mechanism (WRAM) and Modified Cost Balancing Account (MCBA) for each district. The WRAM and MCBA ensure that Cal Water recovers revenues authorized by the CPUC regardless of customer consumption. This has removed the historical disincentive against promoting lower water usage among customers. Through an annual advice letter filing, Cal Water recovers any under-collected metered revenue amounts authorized, or refunds over-collected quantity revenues, via surcharges and surcredits. The advice letters are filed between February and April of each year and address the net WRAM and MCBA balances recorded for the previous calendar year. The majority of WRAM and MCBA balances are collected or refunded through surcharges/surcredits over 12 and 18 months. The WRAM and MCBA amounts are cumulative, so if they are not amortized in a given calendar year, the balance is carried forward and included with the following year balance. Cal Water has a Sales Reconciliation Mechanism (SRM) in place for 2021 and 2022 (the second and third years of its 2018 GRC), that allows the company to adjust its adopted sales forecast if actual sales vary from adopted sales by more than 5.0% in the prior year. The SRM moderates the growth of the net WRAM and MCBA balances until the next GRC.
Regulatory Activity - California
2018 GRC Filing
On July 2, 2018, Cal Water filed a GRC requesting new water infrastructure investments of $828.5 million in accordance with the rate case plan for all of its regulated operating districts for the years 2019, 2020, and 2021. The CPUC evaluated the new water infrastructure improvement investments along with operating budgets to establish water rates that reflect the actual cost of service. The required filing began an approximately 18-month review process, with any changes in customer rates scheduled to become effective on January 1, 2020.
On October 8, 2019, Cal Water jointly filed a formal settlement agreement for its 2018 GRC with the Public Advocates Office of the CPUC covering the majority of open matters in the case. The largest component of the GRC is Cal Water’s Infrastructure Improvement Plan for 2019-2021. The settlement details investment plans that Cal Water and the Public Advocates Office agree should be made to Cal Water’s water infrastructure to continue providing safe, reliable water service to Cal Water customers and communities. A final decision on the case had been expected in late 2019, with new rates going into effect on January 1, 2020. On December 19, 2019, the CPUC extended its statutory deadline to complete the proceeding by six months, to July 1, 2020. The assigned Administrative Law Judge granted Cal Water’s request that final approved rates be treated as effective on January 1, 2020 in the event a delay in the final decision were to preclude implementation of new rates on January 1, 2020.
On October 14, 2020, an ALJ with the CPUC issued a proposed decision for Cal Water's 2018 GRC filing, which was approved by the CPUC on December 4, 2020. The CPUC decision approved the settlement reached in October of 2019 by Cal Water and the CPUC’s Public Advocates Office, allowed Cal Water to continue its decoupling balancing accounts through 2022, and allowed Cal Water to retain its Pension Cost Balancing Account (PCBA) and Health Cost Balancing Account (HCBA). Cal Water is authorized to invest $828 million in its districts through 2021 in order to continue providing safe, reliable water service to its customers throughout California. This includes $148 million of water system infrastructure upgrades that would be recovered via the CPUC’s advice letter procedure after those projects are completed. The decision also authorized total revenue of up to $696.5 million for 2020. The new rates were implemented on February 1, 2021.
Low-Income Water Affordability Proceeding
On August 27, 2020, by a 4-1 vote, the CPUC approved a decision which applies to Cal Water, and other Class A water companies (Joint Parties). The decision precludes the Joint Parties from proposing full decoupling Water Revenue Adjustment Mechanisms in their next GRC filing. Cal Water expects it will be required to comply with the order in its 2021 GRC filing, with rates effective in 2023. Beginning in 2023, Cal Water expects it will experience more revenue volatility and that necessary changes to rate design to mitigate this volatility may dampen conservation price signals, potentially reducing customers’ incentives to pursue water efficiency measures. Cal Water will pursue legal and procedural appeal options to overturn this decision, which Cal Water believes will damage the state’s policy goals for water use efficiency based on an incomplete and insufficient analysis.
9
Interim Rates Memorandum Account (IRMA)
As a result of the delay in the approval of the 2018 GRC, Cal Water requested an IRMA that was approved by the CPUC on November 7, 2019 to record the difference between rates that were billed starting January 1, 2020 (considered to be interim rates), and the rates approved in the GRC (final rates). The 2018 GRC was approved in December of 2020 and final rates for the 2018 GRC were not implemented in 2020; as a result, Cal Water calculated and recorded a regulatory asset of $53.2 million and a corresponding increase to revenue for the difference between final rates and interim rates for all of 2020. Cal Water also recorded a regulatory liability of $1.6 million and a corresponding decrease to regulatory assets for Low-Income Rate Assistance (LIRA) and Rate Support Fund (RSF) program credits that would have been given to customers had the rate case been approved on time.
2020 Cost of Capital Application
By order of the CPUC in its rate case plan for water utilities, Cal Water and three other large water companies were required to request a review of their cost of capital for 2021 through 2023 by May 1, 2020. On January 22, 2020, Cal Water and the three other scheduled companies requested that the CPUC allow a one-year extension to file their Cost of Capital applications by May 1, 2021, rather than May 1, 2020. As part of the request, the companies proposed that there be no changes to their respective costs of capital during the one-year extension. This condition mirrored the condition included in the CPUC’s previous approvals of the water companies’ requests for cost of capital extensions. The companies indicated that postponing the filing one year will alleviate administrative processing costs and provide relief for both CPUC and company resources already strained by numerous CPUC proceedings. On March 11, 2020, the CPUC granted Cal Water and three other large water companies an extension to May 1, 2021 to file their cost of capital application. Cal Water plans to file the cost of capital application by May 1, 2021.
2018 Tax Accounting Memorandum Account (TAMA)
On December 22, 2017, the CPUC sent a letter to All Class A and B Water and Sewer Utilities on the subject of “Changes in Federal Tax Rates for 2018.” The CPUC required Cal Water to establish a memorandum account to track the impact of the TCJA on Cal Water. The TAMA will track the revenue requirement impact of the TCJA not otherwise reflected in rates from January 1, 2018 until current rates are modified to reflect all impacts of the TCJA. The Hawaii Water, Washington Water, and New Mexico Water Commissions have similar requirements to track the impact of the changes to the federal tax law. In 2018, the Company recorded a $5.4 million regulatory liability due to the changes required by the TCJA. The regulatory liability was for the revenue reduction that the Company recorded for the first six months of 2018 during which the new federal corporate income tax rate was yet to be adopted in customer rates.
In May of 2018, Cal Water submitted an advice letter to adopt the new federal corporate income tax rate in customer rates. The annual adopted gross revenue reduction associated with the May 2018 filing was $11.1 million. The new rates became effective on July 1, 2018.
In April of 2019, Cal Water submitted an advice letter to refund $5.0 million of the tax accounting memorandum account's balance associated with the decrease in the federal corporate income tax rate for Cal Water for the first six months of 2018. The new rates became effective April 15, 2019.
In December of 2020, Cal Water submitted an advice letter to refund net credits of $15.4 million that resulted from the re-measurement of deferred income taxes (both plant and non-plant components) as mandated by the TCJA. They represent revenue changes tracked in the TAMA for January 1, 2018 through December 31, 2019, after which Cal Water’s new base rates reflect the changes from TCJA. In the advice letter, Cal Water requested the 12 month refund to become effective on April 15, 2021.
Escalation Increase Requests
As a part of the decision on the 2018 GRC, Cal Water was authorized to request annual escalation rate increases for 2021 for those districts that passed the earnings test. In December of 2020, Cal Water requested escalation rate increases for 2021 in 13 of its regulated districts. The annual adopted gross revenue associated with the December 2020 filing was $8.2 million. The new rates were implemented on February 1, 2021.
10
Expense Offset Requests
Expense offsets are dollar-for-dollar increases in revenue to match increased expenses, and therefore do not affect net operating income. In December of 2019, Cal Water submitted advice letters to request offsets for increases in purchased water costs in six of its regulated districts totaling $2.5 million. The new rates became effective on February 1, 2020.
In December of 2020, Cal Water submitted an advice letter to request offsets for increases in purchased water costs and pump taxes in seven of its regulated districts totaling $5.5 million. The new rates became effective on February 1, 2021.
Rate Base Offset Requests
For construction projects authorized in GRCs as advice letter projects, Cal Water is allowed to request rate base offsets to increase revenues after the project goes into service. In the fourth quarter of 2019, Cal Water submitted advice letters to recover $2.5 million of annual revenue increases for rate base offsets in all of its regulated districts. The new rates became effective on February 1, 2020.
In July of 2020, Cal Water submitted an advice letter to recover $9.0 million of annual revenue increase for a rate base offset in one of its regulated districts. The new rates were implemented on February 1, 2021.
WRAM/MCBA Filings
In March and April of 2020, Cal Water submitted advice letters to true up the revenue under-collections for the 2019 annual WRAMs/MCBAs of its regulated districts. A net under-collection of $27.1 million is being recovered from customers in the form of 12 and 18 month surcharges. Due to the COVID 19 pandemic, Cal Water elected to adjust the 2019 WRAM filing so that the new rates would only be implemented in districts where overall customer bills would not be increased. As a result, approximately $18.8 million of the $45.9 million of net WRAM/MCBA additions from 2019 were deferred to 2021. The new rates incorporate net WRAM/MCBA balances that were previously approved for recovery, and became effective in April of 2020.
Polyfluoroalkyl Substances Memorandum Account (PFAS MA)
Public water systems have been ordered by the State Water Resources Control Board to detect, monitor, and report perfluorooctanoic and perfluorooctanesulfonic acid in drinking water. Cal Water has begun sampling its wells for these contaminants, and anticipates incurring substantial costs in order to comply. In the first quarter of 2020, Cal Water submitted an advice letter to establish a PFAS MA that would give Cal Water the opportunity to track and recover incremental costs related to compliance with the order. In the third quarter of 2020, the CPUC approved by resolution a modified PFAS MA effective March 4, 2020. The approved PFAS MA allows for cost recovery of certain incremental PFAS-related expense, but not capital costs, due to the current lack of a maximum contaminant level.
2019 California Financing Authorization
On November 5, 2020, the CPUC approved Cal Water’s request for an additional $700 million of authorization for debt and equity financing to fund its capital improvement program. The authorization is expected to allow enough financing to fund these improvements through 2025.
Palos Verdes Peninsula Water Reliability Project (Project)
In 2002, Cal Water commissioned a Water System Master Plan (Master Plan) for the Palos Verdes water system. The Master Plan identified the high-priority need to augment the existing potable water system with new transmission mains and a new pump station to improve the capacity and reliability of the water system. This resulted in the development of a capital project known as the Project. Before the Project, a single pipeline that is over 60 years old delivered potable water to approximately 90 percent of the Peninsula, and a second pipeline of the same age delivered water to the remaining 10 percent. Both of these pipelines were approaching the end of their useful lives.
The CPUC authorized Cal Water to recover revenue associated with costs up to a cap of $96.1 million after the Project is in service, subject to the CPUC’s reasonableness review. In 2020, the Project was completed and an Advice Letter 2387 asking for authority to increase rates reflecting the Project costs up to the cap, with an effective date of August 27, 2020 was filed. The advice letter was approved on January 29, 2021. New rates were implemented on February 1, 2021, with the revenue requirement being effective as of August 27, 2020.
Due to the complexity of the project, Cal Water estimates total project costs significantly exceeded the advice letter cap of $96.1 million. Cal Water is in the process of reviewing and validating the final project costs. Once final costs are validated, Cal Water is expecting to recover the exceedance in Cal Water's next GRC.
11
City of Hawthorne GRC filing
Cal Water operates the City of Hawthorne’s water system under a lease agreement that was originally entered into on August 9, 2011. As part of the agreement, Cal Water can request rate increases but requires city council approval for any rate request to take effect. Cal Water requested rate increases of 11.7% in 2020, 11.6% in 2021, and 11.6% in 2022. On August 27, 2019, the rate increases were approved via resolution 8123. The first rate increase became effective on January 1, 2020 and the second rate increase became effective on January 1, 2021.
Regulatory Activity - Other States
Rainier View Water Company (Washington Water)
On March 27, 2020, the Washington Utilities and Transportation Commission (WUTC) approved Washington Water's application for the sale and transfer of assets of Rainier View Water Company. Washington Water took control of the water system on June 1, 2020.
Keauhou Community Services, Inc (Hawaii Water)
In December of 2020, Hawaii Water entered into an agreement with Keauhou Community Services, Inc (KCSI) to acquire its wastewater system assets and provide wastewater utility service to its customers in Keauhou on the island of Hawaii. The purchase is subject to due diligence and approval by the Hawaii Public Utilities Commission (HPUC).
KCSI serves more than 1,500 residential, hotel, and commercial customers, along with the Keauhou Bay Facility and Kahaluu Beach Park, and provides effluent to Kona Country Club, Inc. for golf course irrigation. Hawaii Water has already been operating the Keauhou system since 2018 through an operation and maintenance contract.
Kalaeloa Water Company (Hawaii Water)
On September 25, 2020, the HPUC approved Hawaii Water's application for the purchase of the Membership Interests of Kalaeloa Water Company, LLC. Hawaii Water took control of the water system on November 2, 2020.
Kapalua Water Company and Kapalua Waste Treatment (Hawaii Water)
On June 4, 2020, Hawaii Water filed an application with the HPUC for approval to acquire the assets of Kapalua Water Company, LTD. and Kapalua Waste Treatment Company, LTD in connection with the December 2019 asset purchase agreement with Maui Land and Pineapple Company. The application is pending a final decision by the HPUC.
COVID-19 Deferred Accounting Treatment of COVID-related costs (Hawaii Water)
Decision and Order No. 37291, issued on August 31, 2020 in Docket No. 2020-0091, authorized the Hawaii Water Companies’ request to utilize deferred accounting treatment to accrue and record expenses associated with the COVID-19 Pandemic, incurred from March 4, 2020, through December 31, 2020, subject to certain conditions. Decision and Order No. 37510, issued on December 24, 2020 in Docket No. 2020-0091, authorized Hawaii Water Companies' request to utilize deferred accounting treatment to accrue and record lost gross margins associated with the COVID-19 Pandemic, incurred from March 4, 2020, though December 31, 2020 for their Ka'anapali Division, subject to certain conditions.
Animas Valley Land and Water Co., LLC (New Mexico Water)
In October of 2020, New Mexico Water signed a purchase agreement with Animas Valley Land and Water Co., LLC (AV Water) and court-appointed receiver C. Randel Lewis to acquire the Morning Star Water System assets of AV Water and provide regulated water utility service to its approximately 2,000 customer connections in northwest New Mexico. The purchase is subject to customary closing conditions, including approvals of the San Juan County Court and the New Mexico Public Regulation Commission, as well as successful completion of AV Water’s pending rate case. If approved, the transaction is expected to close in early 2021.
12
Water Supply
Our source of supply varies among our operating districts. Certain districts obtain all of their supply from wells; some districts purchase all of their supply from wholesale suppliers; and other districts obtain supply from a combination of wells and wholesale suppliers. A small portion of supply comes from surface sources and is processed through Company-owned water treatment plants. To the best of management's knowledge, we are meeting water quality, environmental, and other regulatory standards for all Company-owned systems.
Historically, approximately half of our annual water supply is pumped from wells. State groundwater management agencies operate differently in each state. Some of our wells extract ground water from water basins under state ordinances. These are adjudicated groundwater basins, in which a court has settled the dispute between landowners or other parties over how much annual groundwater can be extracted by each party. All of our adjudicated groundwater basins are located in the State of California. Our annual groundwater extraction from adjudicated groundwater basins approximates 5.8 billion gallons or 12.3% of our total annual water supply pumped from wells. Historically, we have extracted less than 100% of our annual adjudicated groundwater rights and have the right to carry forward up to 20% of the unused amount to the next annual period. All of our remaining wells extract ground water from managed or unmanaged water basins. There are no set limits for the ground water extracted from these water basins. Our annual groundwater extraction from managed groundwater basins approximates 27.5 billion gallons or 58.0% of our total annual water supply pumped from wells. Our annual groundwater extraction from unmanaged groundwater basins approximates 14.1 billion gallons or 29.7% of our total annual water supply pumped from wells. Most of the managed groundwater basins we extract water from have groundwater recharge facilities. We are required to pay well pump taxes to financially support these groundwater recharge facilities. Our well pump taxes for 2020, 2019, and 2018 were $12.6 million, $11.5 million, and $14.7 million, respectively. In 2014, the State of California enacted the Sustainable Groundwater Management Act of 2014. The law and its implementing regulations require most basins to select a sustainability agency by 2017, develop a sustainability plan by 2022, and show progress toward sustainability by 2027. We expect that after the act's provisions are fully implemented, substantially all the Company's California groundwater will be produced from sustainably managed and adjudicated basins.
California's normal weather pattern yields little precipitation between mid-spring and mid-fall. The Washington Water service areas receive precipitation in all seasons, with the heaviest amounts during the winter. New Mexico Water's rainfall is heaviest in the summer monsoon season. Hawaii Water receives precipitation throughout the year, with the largest amounts in the winter months. Water usage in all service areas is highest during the warm and dry summers and declines in the cool winter months. Rain and snow during the winter months in California replenish underground water aquifers and fill reservoirs, providing the water supply for subsequent delivery to customers. As of December 30, 2020, the State of California snowpack water content during the 2020-2021 water year is 54% of long-term averages (per the California Department of Water Resources, Northern Sierra Precipitation Accumulation report). The northern Sierra region is the most important for the state’s urban water supplies. The central and southern portions of the Sierras have recorded 59% and 35%, respectively, of long-term averages. Management believes that, notwithstanding lower-than-average snowpack water content, supply pumped from underground aquifers and purchased from wholesale suppliers will be adequate to meet customer demand during 2021 and beyond. Long-term water supply plans are developed for each of our districts to help assure an adequate water supply under various operating and supply conditions. Some districts have unique challenges in meeting water quality standards, but management believes that supplies will meet current standards using currently available treatment processes.
On May 31, 2018, California's Governor signed two bills (Assembly Bill 1668 and Senate Bill 606) into law that will establish long-term standards for water use efficiency. The bills revise and expand the existing urban water management plan requirements to include five year drought risk assessments, water shortage contingency plans, and annual water supply/demand assessments. By June 30, 2022, the California State Water Resources Control Board, in conjunction with the California Department of Water Resources, is expected to establish long-term water use standards for indoor residential use, outdoor residential use, water losses and other uses. Cal Water will also be required to calculate and report on urban water use target by November 1, 2023 and each November 1 thereafter that compares actual urban water use to the target. Management believes that Cal Water is well-positioned to comply with all regulations required of utilities.
13
The following table shows the estimated quantity of water purchased and the percentage of purchased water to total water production in each California operating district that purchased water in 2020. Other than noted below, all other districts receive 100% of their water supply from wells.
| District | Water Purchased (MG) |
Percentage of Total Water Production |
Source of Purchased Supply | ||||||||||||||
| SAN FRANCISCO BAY AREA/NORTH COAST | |||||||||||||||||
| Bay Area Region* | 7,012 | 100 | % | San Francisco Public Utilities Commission and Yolo County Flood Control & Water Conservation District | |||||||||||||
| Bear Gulch | 4,270 | 100 | % | San Francisco Public Utilities Commission | |||||||||||||
| Los Altos | 3,443 | 79 | % | Santa Clara Valley Water District | |||||||||||||
| Livermore | 2,721 | 87 | % | Alameda County Flood Control and Water Conservation District, Zone 7 | |||||||||||||
| SACRAMENTO VALLEY | |||||||||||||||||
| Oroville | 895 | 100 | % | Pacific Gas and Electric Co. and County of Butte | |||||||||||||
| SAN JOAQUIN VALLEY | |||||||||||||||||
| Bakersfield | 11,056 | 54 | % | Kern County Water Agency and City of Bakersfield | |||||||||||||
| Stockton | 7,402 | 94 | % | Stockton East Water District | |||||||||||||
| LOS ANGELES AREA | |||||||||||||||||
| East Los Angeles | 1,291 | 28 | % | Central Basin Municipal Water District | |||||||||||||
| Dominguez | 9,184 | 87 | % | West Basin Municipal Water District and City of Torrance | |||||||||||||
| City of Commerce | 443 | 66 | % | Central Basin Municipal Water District | |||||||||||||
| City of Hawthorne | 1,125 | 88 | % | West Basin Municipal Water District | |||||||||||||
| Hermosa Redondo | 3,469 | 96 | % | West Basin Municipal Water District | |||||||||||||
| Los Angeles County Region** | 5,942 | 97 | % | West Basin Municipal Water District and Antelope Valley-East Kern Water Agency | |||||||||||||
| Westlake | 2,449 | 100 | % | Calleguas Municipal Water District and Triunfo Water and Sanitation District | |||||||||||||
| Kern River Valley | 59 | 23 | % | City of Bakersfield | |||||||||||||
_______________________________________________________________________________
MG = million gallons
* Bay Area Region includes Bayshore and Redwood Valley
** Los Angeles County Region includes Palos Verdes and Antelope Valley
The Bear Gulch district obtains a portion of its water supply from surface runoff from the local watershed. The Oroville district in the Sacramento Valley, the Bakersfield district in the San Joaquin Valley, and the Kern River Valley district in the Los Angeles Area purchase water from a surface supply. Surface sources are processed through our water treatment plants before being delivered to the distribution system. The Bakersfield district also purchases treated water as a component of its water supply.
The Chico, Marysville, Dixon, and Willows districts in the Sacramento Valley, the Salinas Valley Region district in the Salinas Valley, the Selma and Visalia districts in the San Joaquin Valley, and the TAFB in Solano County obtain their entire supply from wells.
Purchases for the Los Altos, Livermore, Oroville, Redwood Valley, Stockton, and Bakersfield districts are pursuant to long-term contracts expiring on various dates after 2020. The water supplies purchased for the Dominguez, East Los Angeles, Hermosa Redondo, Palos Verdes, and Westlake districts as well as the Hawthorne and Commerce systems are provided by public agencies pursuant to a statutory obligation of continued non-preferential service to purveyors within the agencies' boundaries. Purchases for the Bayshore and Bear Gulch districts are in accordance with long-term contracts with the San Francisco Public Utilities Commission (SFPUC) until June 30, 2034.
14
Management anticipates water supply contracts will be renewed as they expire though the price of wholesale water purchases is anticipated to increase in the future.
Shown below are wholesaler price rates and increases that became effective in 2020 and estimated wholesaler price rates and percent changes for 2021. In 2020, several districts experienced purchased water rate increases, resulting in the filing of several purchased water offsets.
| 2020 | 2021 | |||||||||||||||||||||||||||||||||||||
| Effective Month |
Percent Change |
Effective Month |
Percent Change |
|||||||||||||||||||||||||||||||||||
| District | Unit Cost | Unit Cost | ||||||||||||||||||||||||||||||||||||
| Antelope | January | $648.00 /af | 7.6 | % | January | $665.00 /af | 2.6 | % | ||||||||||||||||||||||||||||||
| Bakersfield(1) | July | $179.00 /af | 3.5 | % | July | $179.00 /af | — | |||||||||||||||||||||||||||||||
| Bear Gulch | July | $4.10 /ccf | — | July | $4.10 /ccf | — | ||||||||||||||||||||||||||||||||
| Commerce(2) | January | $1,268.00 /af | 2.3 | % | January | $1,302.00 /af | 2.7 | % | ||||||||||||||||||||||||||||||
| Dominguez(2) | January | $1,405.00 /af | 1.4 | % | January | $1,441.00 /af | 2.6 | % | ||||||||||||||||||||||||||||||
| East Los Angeles(2) | January | $1,268.00 /af | 2.3 | % | January | $1,302.00 /af | 2.7 | % | ||||||||||||||||||||||||||||||
| Hawthorne(2) | January | $1,405.00 /af | 1.4 | % | January | $1,441.00 /af | 2.6 | % | ||||||||||||||||||||||||||||||
| Hermosa Redondo(2) | January | $1,405.00 /af | 1.4 | % | January | $1,441.00 /af | 2.6 | % | ||||||||||||||||||||||||||||||
| Livermore | January | $2.10 /ccf | 4.5 | % | January | $2.10 /ccf | — | |||||||||||||||||||||||||||||||
| Los Altos | January | $1,474.00 /af | — | July | $1,474.00 /af | — | ||||||||||||||||||||||||||||||||
| Oroville(2) | April | $185,079.44 /yr | 1.9 | % | April | $185,079.44 /yr | — | |||||||||||||||||||||||||||||||
| Palos Verdes(2) | January | $1,385.00 /af | 1.4 | % | January | $1,441.00 /af | 2.6 | % | ||||||||||||||||||||||||||||||
| Mid-Peninsula | July | $4.10 /ccf | — | July | $4.10 /ccf | — | ||||||||||||||||||||||||||||||||
| Redwood Valley | April | $69.24 /af | 5.0 | April | $69.24 /af | — | ||||||||||||||||||||||||||||||||
| South San Francisco | July | $4.10 /ccf | — | July | $4.10 /ccf | — | ||||||||||||||||||||||||||||||||
| Stockton | April | $1,452,239.35 /mo | 37.0 | % | April | $1,452,239.35 /mo | — | |||||||||||||||||||||||||||||||
| Westlake | January | $1,423.00 /af | 3.4 | % | January | $1,507.00 /af | 2.4 | % | ||||||||||||||||||||||||||||||
_______________________________________________________________________________
af = acre foot;
ccf = hundred cubic feet;
yr = fixed annual cost;
mo = fixed monthly cost
(1)untreated water
(2)wholesaler price changes occur every six months
We work with all local suppliers and agencies responsible for water supply to enable adequate, long-term supply for each system.
See Item 7, "Management's Discussion and Analysis of Financial Condition and Results of Operations—Water Supply" for more information on adequacy of supplies.
15
Seasonal Fluctuations
In California, our customers' consumption pattern of water varies with the weather, in terms of rainfall and temperature. In the WRAM and MCBA design, the CPUC considers the historical pattern in determining the adopted sales and production costs. With a majority of our sales being subject to the WRAM and production costs being covered by the MCBA, fluctuations in financial results have been minimized. However, cash flows from operations and short-term borrowings on our credit facilities can be significantly impacted by seasonal fluctuations including recovery of the WRAM and MCBA.
Our water business is seasonal in nature. Weather conditions can have a material effect on customer usage. Customer demand for water generally is lower during the cooler and rainy winter months. Demand increases in the spring when warmer weather returns and the rains end, and customers use more water for outdoor purposes such as landscape irrigation. Warm temperatures during the generally dry summer months result in increased demand. Water usage declines during the late fall as temperatures decrease and the rainy season begins. During years in which precipitation is especially heavy or extends beyond the spring into the early summer, customer demand can decrease from historic normal levels, generally due to reduced outdoor water usage. Likewise, an early start to the rainy season during the fall can cause a decline in customer usage. As a result, seasonality of water usage has a significant impact on our cash flows from operations and borrowing on our short-term facilities.
Utility Plant Construction
We have continually extended, enlarged, and replaced our facilities as required to meet increasing demands and to maintain the water systems. We obtain construction financing using funds from operations, short-term bank borrowings, long-term financing, advances for construction and contributions in aid of construction that are funded by developers. Advances for construction are cash deposits from developers for construction of water facilities or water facilities deeded from developers. These advances are generally refundable without interest over a period of 40 years in equal annual payment amounts and developer installed facilities are exempt from corporate income taxes. Contributions in aid of construction consist of nonrefundable cash deposits or facilities transferred from developers, primarily for fire protection and relocation projects. We cannot control the amounts received from developers. This amount fluctuates from year-to-year as the level of construction activity carried on by developers varies. This activity is impacted by the demand for housing, commercial development, and general business conditions, including interest rates.
See Item 7, "Management's Discussion and Analysis of Financial Condition and Results of Operations—Liquidity and Capital Resources" for additional information.
Energy Reliability
We continue to use power efficiently to minimize the power expenses passed on to our customers, and maintain backup power systems to continue water service to our customers if the power companies' supplies are interrupted. Many of our well sites are equipped with emergency electric generators designed to produce electricity to keep the wells operating during power outages. Storage tanks also provide customers with water during blackout periods.
During 2020 and 2019, we leased additional emergency generators to respond to potential PSPSs, a new electric utility operating paradigm approved by the CPUC.
Security at Company Facilities
Due to terrorism and other risks, we have heightened security at our facilities and have taken added precautions to protect our employees and the water delivered to customers. In 2002, federal legislation was enacted that resulted in new regulations concerning security of water facilities, including submitting vulnerability assessment studies to the federal government. We have complied with regulations issued by the U.S. Environmental Protection Agency (EPA) pursuant to federal legislation concerning vulnerability assessments and have made filings to the EPA as required. In addition, communication plans have been developed as a component of our procedures. While we do not make public comments on our security programs, we have been in contact with federal, state, and local law enforcement agencies to coordinate and improve our water delivery systems' security.
On October 23, 2018, America’s Water Infrastructure Act (AWIA) became law. We must now conduct additional risk and resilience assessments and develop emergency response plans for each of our water systems. These assessments and plans include natural hazards as well as malevolent acts. The first such assessments were filed in 2020. They will be reviewed and resubmitted every five years.
While we do not make public comments on our security programs, we have been in contact with federal, state, and local law enforcement agencies to coordinate and improve our water delivery systems' security
16
Competition and Condemnation
Our principal operations are regulated by the Commission of each state. Under state laws, no privately owned public utility may compete within any service territory that we already serve without first obtaining a certificate of public convenience and necessity from the applicable Commission. Issuance of such a certificate would only be made upon finding that our service is deficient. To management's knowledge, no application to provide service to an area served by us has been made.
State law provides that whenever a public agency constructs facilities to extend a utility system into the service area of a privately owned public utility, such an act constitutes the taking of property and requires reimbursement to the utility for its loss. State statutes allow municipalities, water districts and other public agencies to own and operate water systems. These agencies are empowered to condemn properties already operated by privately owned public utilities. The agencies are also authorized to issue bonds, including revenue bonds, for the purpose of acquiring or constructing water systems. However, if a public agency were to acquire utility property by eminent domain action, the utility would be entitled to just compensation for its loss. In Washington, annexation was approved in February 2008 for property served by us on Orcas Island; however, we continue to serve the customers in the annexed area and do not expect the annexation to impact our operations. To management's knowledge, other than the Orcas Island property, no municipality, water district, or other public agency is contemplating or has any action pending to acquire or condemn any of our systems.
Government Regulations
Our water and wastewater services are governed by various federal and state environmental protection, health and safety laws and regulations. These provisions establish criteria for drinking water and for discharges of water, wastewater and airborne substances. The EPA, state water quality regulators, and other state regulatory authorities promulgate numerous nationally and locally applicable standards, including maximum contaminant levels (MCLs) for drinking water. We believe we are currently in compliance with all of the MCLs promulgated to date.
Environmental Matters
Our operations are subject to environmental regulation by various governmental authorities. Environmental health and safety programs have been designed to provide compliance with water discharge regulations, underground and aboveground fuel storage tank regulations, hazardous materials management plans, hazardous waste regulations, air quality permitting requirements, wastewater discharge limitations and employee safety issues related to hazardous materials. Also, we actively investigate alternative technologies for meeting environmental regulations and continue the traditional practices of meeting environmental regulations.
For a description of the material effects that compliance with environmental regulations may have on us, see Item 1A. "Risk Factors—Risks Related to Our Regulatory Environment." We expect environmental regulation to increase, resulting in higher operating costs in the future, and there can be no assurance that the Commissions would approve rate increases to enable us to recover these additional compliance costs.
Quality of Water Supply
Our operating practices are designed to produce potable water in accordance with accepted water utility practices. Water entering the distribution systems from surface sources is treated in compliance with federal and state Safe Drinking Water Act (SDWA) standards. Most well supplies are chlorinated or chloraminated for disinfection. Water samples from each water system are analyzed on a regular, scheduled basis in compliance with regulatory requirements. We operate a state-certified water quality laboratory at the San Jose Customer Support Services Office that provides testing for most of our California operations. Certain tests in California are contracted with independent certified labs qualified under the Environmental Laboratory Accreditation Program. Local independent state certified labs provide water sample testing for the Washington, New Mexico and Hawaii operations.
In recent years, federal and state water quality regulations have resulted in increased water sampling requirements. The SDWA continues to be used to monitor and regulate additional potential contaminants to address public health concerns. The State of California has continued to adopt new water quality regulations which may be in addition to those adopted by the EPA. We monitor water quality standard changes and upgrade our treatment capabilities to maintain compliance with the various regulations.
17
Impact of Climate Change Legislation and Regulation
Our operations depend on power provided by other public utilities and, in emergencies, power generated by our portable and fixed generators. If future legislation limits emissions from the power generation process, our cost of power may increase. Any increase in the cost of power will be passed along to our California customers through the MCBA or included in our cost of service paid by our customers as requested in our GRC filings.
We maintain a fleet of vehicles to provide service to our customers, including a number of heavy duty diesel vehicles that were retrofitted to meet California emission standards. If future legislation further impacts the cost to operate the fleet or the fleet acquisition cost in order to meet certain emission standards, it will increase our cost of service and our rate base. Any increase in fleet operating costs associated with meeting emission standards will be included in our cost of service paid by our customers as requested in our GRC filings. While recovery of these costs is not guaranteed, we would expect recovery in the regulatory process.
Under the California Environmental Quality Act (CEQA), all capital projects of a certain type (primarily wells, tanks, major pipelines and treatment facilities) require mitigation of greenhouse gas emissions. The cost to prepare the CEQA documentation and permit will be included in our capital cost and added to our rate base, which will be requested to be paid for by our customers. Any increase in the operating cost of the facilities will also be included in our cost of service paid by our customers as requested in our GRC filings. While recovery of these costs is not guaranteed, we would expect recovery in the regulatory process.
Cap and trade regulations were implemented in 2012 with the goal of reducing emissions to 1990 levels by the year 2020. These regulations have not impacted water utilities at this time. In the future, if we are required to comply with these regulations, any increase in operating costs associated with meeting these standards will be included in our cost of service paid by our customers as requested in our GRC filings. While recovery of these costs is not guaranteed, we would expect recovery in the regulatory process.
Human Capital Resources
We believe our employees are our most important resources and are critical to our continued success. We focus significant attention on attracting and retaining talented and experienced individuals to manage and support our operations. We offer our employees a broad range of company-paid benefits, and we believe our compensation package and benefits are competitive with others in our industry. Additional information about our employee benefit plans is included in Note 12.
We are committed to hiring, developing and supporting a diverse and inclusive workplace. Our employees are expected to exhibit and promote honest, ethical, and respectful conduct in the workplace. All of our employees must adhere to a code of conduct that sets standards for appropriate behavior and includes required internal training on preventing, identifying, reporting and stopping any type of discrimination.
Employee health and safety in the workplace is one of the Company’s core values. Safety efforts are led by the Corporate Safety Committee and supported by safety committees that operate at the local level. Hazards in the workplace are actively identified and management tracks incidents so remedial actions can be taken to improve workplace safety. The COVID-19 pandemic has underscored for us the importance of keeping our employees safe and healthy. In response to the pandemic, the Company has taken actions aligned with the World Health Organization and the Centers for Disease Control and Prevention to protect its workforce so they can more safely and effectively perform their work.
Our management team supports a culture of developing future leaders from our existing workforce, enabling us to promote from within for many leadership positions. We believe this provides long-term focus and continuity to our operations while also providing opportunities for the growth and advancement of our employees. Our focus on retention is evident in the length of service of our management team. The average tenure of our management team is over 15 years.
Employee levels are managed to align with the pace of business and management believes it has sufficient human capital to operate its business successfully. Management believes that the Company's employee relations are favorable. At December 31, 2020, we had 1,192 employees, including 78 at Washington Water, 43 at Hawaii Water, and 15 at New Mexico Water. In California, the Utility Workers Union of America, AFL-CIO represents most non-exempt employees. The International Federation of Professional and Technical Engineers, AFL-CIO represents our professional and technical engineering and laboratory employees.
18
As of December 31, 2020, we had 743 union employees. In January 2015, the Company negotiated a six-year contract. For 2019 and 2020, the agreement established three regions for pay purposes (Region 1, Region 2, and Region 3). In 2020, employees in Region 1 received an increase in base pay of 2.9%, employees in Region 2 received an increase in base pay of 2.9%, plus a regional differential of 0.9% added to their pay (based on the CPI for the Los Angeles area), and employees in Region 3 received an increase in base pay of 2.9%, plus a 1.1% regional differential (based on the CPI for the San Francisco area). The current agreement with the unions was effective through 2020. We are currently negotiating a new contract. Management works hard with its two unions to maintain good labor-management relations.
Employees at Hawaii Water, Washington Water and New Mexico Water are not represented by unions.
Information About Our Executive Officers
| Name | Positions and Offices with California Water Service Group | Age | |||||||||
| Martin A. Kropelnicki (1) | President and Chief Executive Officer since September 1, 2013. Formerly, President and Chief Operating Officer (2012-2013), Chief Financial Officer and Treasurer (2006-2012), served as Chief Financial Officer of Power Light Corporation (2005-2006), Chief Financial Officer and Executive Vice President of Corporate Services of Hall Kinion and Associates (1997-2004), Deloitte & Touche Consulting (1996-1997), held various positions with Pacific Gas & Electric (1989-1996). | 54 | |||||||||
| Thomas F. Smegal III (2) | Vice President, Chief Financial Officer and Treasurer since October 1, 2012. Formerly, Vice President, Regulatory Matters and Corporate Relations (2008-2012), Manager of Rates (2002-2008), Regulatory Analyst (1997-2002), served as Utilities Engineer at the California Public Utilities Commission (1990-1997). | 53 | |||||||||
| Paul G. Townsley (2) | Vice President of Corporate Development and Chief Regulatory Matters Officer effective January 1, 2019. Formerly Vice President of Rates and Regulatory Matters (2013-2018), Divisional Vice President, Operations and Engineering for EPCOR Water USA (2012-2013), served as President of American Water Works Company subsidiaries in Arizona, New Mexico, and Hawaii (2007-2012), served as American Water Works Company's President, Western Region (2002-2007), held various other positions with Citizens Utilities Company (1982-2002). | 63 | |||||||||
| Robert J. Kuta (2) | Vice President of Engineering and Chief Water Quality and Environmental Compliance Officer effective January 1, 2019. Formerly Vice President of Engineering (2015-2018), Senior Vice President of Operations Management Services, Water, Environmental and Nuclear markets for CH2M Hill (2006 to 2015), served as Western Region Vice President of Service Delivery and President of Arizona American Water Company (2001 to 2005), and held various management positions at Citizens Water Resource Company, Chaparral City Water Company, and Spring Creek Utilities (1993 to 2001). | 56 | |||||||||
Michael B. Luu (2) |
Vice President of Information Technology and Chief Risk Officer since January 1, 2021. Formerly Vice President of Customer Service and Chief Information Officer (2017-2020), Vice President of Customer Service and Information Technology (2013-2016), Acting California Water Service Company District Manager, Los Altos (2012-2013), Director of Information Technology (2008-2012), CIS Development Manager (2005-2008), held various other positions with California Water Service Company since 1999. |
41 | |||||||||
| Ronald D. Webb (2) | Vice President of Human Resources since August 11, 2014. Formerly Managing Director, Human Resources Partner for United Airlines (2006-2014), served as Vice President of Human Resources for Black & Decker Corporation (1995-2005), Human Resource Manager for General Electric Company (1990-1994), and held various labor relations positions for National Steel and Shipbuilding Company (1982-1989). | 64 | |||||||||
| Lynne P. McGhee (2) | Vice President and General Counsel since January 1, 2015. Formerly Corporate Secretary (2007-2014), Associate Corporate Counsel (2003-2014), and served as a Commissioner legal advisor and staff counsel at the California Public Utilities Commission (1998-2003). | 56 | |||||||||
| David B. Healey (2) | Vice President, Corporate Controller and Assistant Treasurer since January 1, 2015. Formerly Corporate Controller and Assistant Treasurer (2012-2014), Director of Financial Reporting (2009-2012), served as Subsidiary Controller for SunPower Corporation (2005-2009), Corporate Controller for Hall, Kinion & Associates, Inc. (1997-2005), held various other positions with Pacific Gas & Electric Company (1985-1997). | 64 | |||||||||
19
| Name | Positions and Offices with California Water Service Group | Age | |||||||||
| Shannon C. Dean (2) | Vice President of Customer Service and Chief Citizenship Officer since January 1, 2021. Formerly Vice President of Corporate Communications & Community Affairs (2015-2020), Director of Corporate Communications (2000-2014), held various corporate communications, government and community relations for Dominguez Water Company (1991-1999). | 53 | |||||||||
| Gerald A. Simon (2)(3) | Vice President, Chief Safety, Security, and Emergency Preparedness Officer effective January 1, 2019. Formerly Chief Safety and Emergency Preparedness Officer (2016-2018), Director of Safety and Emergency Services (2015), Emergency Services Manager (2014), Emergency Services Coordinator (2013), served as Fire Chief for Oakland, CA (2008-2011) and (1999-2004), Fire Chief for Fort Lauderdale, FL (2006-2007), Fire Chief for Union City, CA (2005-2006), Fire Chief for Santa Clara, CA (1993-1999) held various other positions at Santa Clara Fire Department (1976-1999), and Fire Services Consultant (1985-2015). | 66 | |||||||||
| Michelle R. Mortensen (2) | Vice President, Corporate Secretary since January 1, 2021. Formerly Corporate Secretary (2015-2020), Assistant Corporate Secretary (2014), Treasury Manager (2012-2013), Assistant to the Chief Financial Officer (2011), Regulatory Accounting Manager (2008-2010), held various accounting positions at Piller Data Systems (2006-2007), Hitachi Global Storage (2005), Abbot Laboratories (1998-2004), and Symantec (1998-2001). | 46 | |||||||||
| Elissa Y. Ouyang (2) | Chief Procurement and Lead Continuous Improvement Officer since March 1, 2016. Formerly, Interim Procurement Director (2013-2016), Acting District Manager - Los Altos (2013), Interim Vice President of Information Technology (2012-2013), Director of Information Technology - Architecture and Security (2008-2012), Business Application Manager (2003-2007), Project Lead/Senior Developer (2001-2003), held various business consulting positions at KPMG Consulting/BearingPoint (1998-2001), and RR Donnelley (1996-1998). | 52 | |||||||||
| Michael S. Mares, Jr (2) | Vice President of Operations since January 1, 2021. Formerly, Vice President, California Operations (2019-2020), California Water Service Company District Manager, Bakersfield (2017-2018), Hawaii Water Service Company General Manager (2014-2016), Hawaii Water Service Company Local Manager, Big Island (2012-2014), California Water Service Company, held various Superintendent positions in the Chico district (2002-2012), California Water Service Company, held various union positions in the Chico district (1992-2002). | 54 | |||||||||
_______________________________________________________________________________
(1)Holds the same position with California Water Service Company, CWS Utility Services, Hawaii Water Service Company, Inc., and New Mexico Water Service Company; Chief Executive Officer of Washington Water Service Company.
(2)Holds the same position with California Water Service Company, CWS Utility Services, Hawaii Water Service Company, Inc., New Mexico Water Service Company, and Washington Water Service Company.
(3)Scheduled to retire in Q2 of 2021.
Item 1A. Risk Factors.
In evaluating our business, you should carefully consider the following discussion of material risks, events and uncertainties that make an investment in us speculative or risky in addition to the other information in this Annual Report on Form 10-K. A manifestation of any of the following risks and uncertainties could, in circumstances we may or may not be able to accurately predict, materially and adversely affect our business, growth, reputation, prospects, operating and financial results, financial condition, cash flows, liquidity and stock price. We note these factors for investors as permitted by the Private Securities Litigation Reform Act of 1995. It is not possible to predict or identify all such factors; our operations could also be affected by factors, events or uncertainties that are not presently known to us or that we currently do not consider to present significant risks to our operations. Therefore, you should not consider the following risks to be a complete statement of all the potential risks or uncertainties that we face.
20
Risks Related to Our Regulatory Environment
Our business is heavily regulated by state and federal regulatory agencies and our financial viability depends upon our ability to recover costs from our customers through rates that must be approved by state public utility commissions.
California Water Service Company, New Mexico Water Service Company, Washington Water Service Company and Hawaii Water Service Company, Inc., are regulated public utilities which provide water and water-related service to our customers. The rates that we charge our water customers are subject to the jurisdiction of the regulatory commissions in the states in which we operate. These Commissions may set water and water-related rates for each operating district independently because the systems are not interconnected. The Commissions authorize us to charge rates that they consider to be sufficient to recover normal operating expenses, to provide funds for adding new or replacing water infrastructure, and to allow us to earn what the Commissions consider to be a fair and reasonable return on invested capital.
Our revenues and consequently our ability to meet our financial objectives are dependent upon the rates we are authorized to charge our customers by the Commissions and our ability to recover our costs in these rates. Our management uses forecasts, models and estimates in order to set rates that will provide a fair and reasonable return on our invested capital. While our rates must be approved by the Commissions, no assurance can be given that our forecasts, models and estimates will be correct or that the Commissions will agree with our forecasts, models and estimates. If our rates are set too low, our revenues may be insufficient to cover our operating expenses, capital expenditure requirements and desired dividend levels.
We periodically file rate increase applications with the Commissions. The ensuing administrative and hearing process may be lengthy and costly. The decisions of the Commissions are beyond our control and we can provide no assurances that our rate increase requests will be granted by the Commissions. Even if approved, there is no guarantee that approval will be given in a timely manner or at a sufficient level to cover our expenses and provide a reasonable return on our investment. If the rate increase decisions are delayed, our earnings may be adversely affected. For example, the CPUC did not issue its decision on our 2018 GRC until December 2020, approximately one year later than expected, which caused some financial and operating uncertainty for the Company during 2020.
Our evaluation of the probability of recovery of regulatory assets is subject to adjustment by regulatory agencies and any such adjustment could adversely affect our results of operations and financial condition.
Regulatory decisions may also impact prospective revenues and earnings, affect the timing of the recognition of revenues and expenses and may overturn past decisions used in determining our revenues and expenses. Our management continually evaluates the anticipated recovery of regulatory assets and revenues subject to refund and provides for allowances and/or reserves as deemed necessary. Current accounting procedures allow us to defer certain costs if we believe it is probable that we will be allowed to recover those costs through future rate increases. If the Commissions determined that a portion of our assets were not recoverable in customer rates, we may suffer an asset impairment which would require a write down in such asset's valuation which would be recorded through operations.
If our assessment as to the probability of recovery through the ratemaking process is incorrect, the associated regulatory asset would be adjusted to reflect the change in our assessment or any regulatory disallowances. A change in our evaluation of the probability of recovery of regulatory assets or a regulatory disallowance of all or a portion of our cost could have a material adverse effect on our financial results.
Regulatory agencies may disagree with our valuation and characterization of certain of our assets.
If we determine that assets are no longer used or useful for utility operations, we may remove them from our rate base and subsequently sell those assets with any gain on sales accruing to the stockholders, subject to certain conditions. If the Commissions disagree with our characterization, there is a risk that the Commissions could determine that realized appreciation in property value should be awarded to customers rather than our stockholders.
Changes in laws, rules and policies of our regulators or operating jurisdictions can significantly affect our business.
Regulatory agencies may change their rules and policies for various reasons, including changes in the local political environment. Regulators are elected by popular vote or are appointed by elected officials, and the results of elections may change the long-established rules and policies of an agency dramatically. For example, in 2020 regulation regarding full decoupling WRAMs changed in California. Since 2008, the CPUC allowed full decoupling WRAMs. However, in 2020, the CPUC precluded companies from proposing full decoupling WRAMs in their next GRC filings. The decision by the CPUC to change its policy will affect our business beginning in 2023.
21
We rely on policies and regulations promulgated by the various state commissions in order to recover capital expenditures, maintain favorable treatment on gains from the sale of real property, offset certain production and operating costs, recover the cost of debt, maintain an optimal equity structure without over-leveraging, and have financial and operational flexibility to engage in non-regulated operations. If any of the Commissions with jurisdiction over us implements policies and regulations that do not allow us to accomplish some or all of the items listed above, our future operating results may be adversely affected.
In addition, legislatures may repeal, relax or tighten existing laws, or enact new laws that impact the regulatory agencies with jurisdiction over our business or affect our business directly. If changes in existing laws or the implementation of new laws limit our ability to accomplish some of our business objectives, our future operating results may be adversely affected.
Finally, local jurisdictions may impose new ordinances, laws, fees, and regulations that could increase costs or limit our operations in ways which impact future operating results. Cities may impose or amend franchise requirements, impose conditions on underground construction or land use, impose various taxes and fees, or restrict our hours for construction, among other things. In the last decade, more cities have imposed excavation moratoria or paving rules which has required more costly construction than anticipated.
We expect environmental health and safety regulation to increase, resulting in higher operating costs in the future and the potential that the company fails to meet these regulatory standards.
Our water and wastewater services are governed by various federal and state environmental protection, health and safety laws and regulations. Although we have a rigorous water quality assurance program in place, we cannot guarantee that we will continue to comply with all standards. If we violate any federal or state regulations or laws governing health and safety, we could be subject to substantial fines or otherwise sanctioned, subject to potential civil liability for damages, and our customers' trust in our operations ability could be eroded.
Environmental health and safety laws are complex and change frequently. They tend to become more stringent over time. As new or stricter standards are introduced, they could increase our operating costs. Although we would likely seek permission to recover these costs through rate increases, we can give no assurance that the Commissions would approve rate increases to enable us to recover these additional compliance costs.
We are required to test our water quality for certain chemicals and potential contaminants on a regular basis. If the test results indicate that our water exceeds allowable limits, we may be required either to commence treatment to remove the contaminant or to develop an alternate water source. Either of these results may be costly. Although we would likely seek permission to recover these through rate increases, there can be no assurance that the Commissions would approve rate increases to enable us to recover these additional compliance costs.
Recent events in the utility sector, including those in Flint, Michigan and related to Pacific Gas and Electric Company in California, show that failure to meet one or more water quality, environmental, or safety standards can have severe effects on customer trust, regulatory treatment, or civil and criminal liability.
New and/or more stringent water quality regulations could increase our operating costs.
We are subject to water quality standards set by federal, state and local authorities that have the power to issue new regulations. Compliance with new regulations that are more stringent than current regulations could increase our operating costs.
In August of 2009, the Office of Environmental Health Hazard Assessment within the California Environmental Protection Agency changed the water quality standard for TCP in our water supply. The new standard requires us to have 0.0007 parts per billion or less of TCP in our California water supply. We have incurred costs associated with the compliance of the new TCP standard and expect to continue to incur costs in the future. In 2018, we received proceeds from a TCP settlement (see note 15 in the Notes to the Consolidated Financial Statements) that has been used to offset some of the compliance costs that we have incurred. Although we would likely seek permission to these additional costs through the GRC process, we can give no assurance that the CPUC would approve the recovery of these additional compliance costs.
Perfluorooctane sulfonate (PFOS) and perfluorooctanoic acid (PFOA) are two water contaminants of emerging concern. Although a water quality standard has yet to be set by federal or state regulators, preliminary testing and guidance from the California Environmental Protection Agency has affected our operations of some wells in California. We expect that a water quality standard will be set in the future and that we will incur costs to comply with the water quality standard. Cal Water has requested and been approved to use a memorandum account to track the incremental compliance costs in the future and we would likely seek permission to recover additional costs of compliance through rate increases; however, we can give no assurance that the CPUC would approve rate increases to enable us to recover these additional compliance costs.
22
Legislation and regulation designed to mitigate or adapt to climate change may impact our operations.
Future legislation or regulation regarding climate change may restrict our operations or impose new costs on our business. Our operations depend on power provided by other public utilities and, in emergencies, power generated by our portable and fixed generators. If future legislation or regulation limits emissions from the power generation process, our cost of power may increase. Any increase in the cost of power will be passed along to our California customers through the MCBA or included in our cost of service paid by our customers as requested in our GRC filings in California.
We have been and may in the future be party to environmental and product-related lawsuits which could result in us paying damages not covered by insurance.
We have been and may be in the future, party to water contamination lawsuits, which may not be fully covered by insurance.
The number of environmental and product-related lawsuits against other water utilities have increased in frequency in recent years. If we are subject to additional environmental or product-related lawsuits, we might incur significant legal costs and it is uncertain whether we would be able to recover the legal costs from customers or other third parties. In addition, if current California law regarding CPUC's preemptive jurisdiction over regulated public utilities for claims about compliance with California Department of Health Services and United States EPA water quality standards changes, our legal exposure may be significantly increased.
Risks Related to Our Business Operations
The Ongoing COVID-19 Pandemic May Adversely Affect Our Operations
Although the COVID-19 pandemic did not have a significant impact on our business in 2020, we are unable to accurately predict the full impact that the ongoing COVID-19 pandemic will have on our business, results of operations, financial condition or liquidity due to numerous uncertainties, including the duration and severity of the outbreak, potential resurgence and /or mutations of the virus, and the development, distribution and public acceptance of treatments and vaccines. As an “essential business” during times of emergencies pursuant to the U.S. Critical Infrastructures Protection Act of 2001, we are working to continue to provide high quality water and wastewater services to our two million customers. During the course of 2020, shelter-in-place and social distancing ordinances of varying durations and scope were implemented in all of the states in which we operate. Such governmental orders resulted in temporary closures of non-essential businesses and self-quarantining on non-essential workers. If we close any of our facilities due to a COVID-19 outbreak or if a critical number of our employees become too ill to work, our business operations could be materially adversely affected in a rapid manner. In addition, the COVID-19 pandemic has resulted in significant disruption to economic activity and the states in which the Company operates have experienced significant increases in unemployment claims and business closures. The Company has also ceased all shutoffs for nonpayment during the pandemic. If a significant number of customers are unable to pay utility bills for an extended period of time our business, results of operations, financial condition or liquidity may be materially adversely affected.
We may be at risk for litigation under the principle of inverse condemnation for activities in the normal course of business which have a damaging effect on private property.
The California constitution may allow compensation to property owners for a public utility taking or damaging private property, even when damage occurs through no fault of the utility and regardless of whether the damage could be foreseen by the utility. As a result, this doctrine, which is known as inverse condemnation and is routinely invoked in California, imposes strict liability for damages, including legal fees, as a result of the design, construction and maintenance of utility facilities. In addition to claims that our water or wastewater systems damaged property, Cal Water could be sued under inverse condemnation if its facilities or operations damage private property or if it is unable to timely deliver sufficient quantities of water for firefighting because of system capacity limitations or water supply disruptions, including as a result of action taken by an electric utility pursuant to a PSPS program or other loss of power. Although the imposition of liability is premised on the assumption that utilities have the ability to recover these costs from their customers, there is no assurance that the CPUC would allow Cal Water to recover any such damage awards from customers. For example, in December 2017, the CPUC denied recovery of costs that San Diego Gas & Electric Company incurred as a result of inverse condemnation, holding that the inverse condemnation principles of strict liability are not relevant to the CPUC’s prudent manager standard.
23
The effects of natural disasters, attacks by third parties, pandemics, or poor water quality or contamination to our water supply may result in disruption in our services and litigation which could adversely affect our business, operating results and financial condition.
We operate in areas that are prone to earthquakes, fires, mudslides and other natural disasters. A significant seismic event or other natural disaster in California where our operations are concentrated could adversely impact our ability to deliver water and adversely affect our costs of operations. A major disaster could damage or destroy substantial capital assets. The CPUC has historically allowed utilities to establish a catastrophic event memorandum account as another possible mechanism to recover costs. However, we can give no assurance that the CPUC or any other commission would allow any such cost recovery mechanism in the future.
Our water supplies are subject to contamination, including contamination from the development of naturally-occurring compounds, chemicals in groundwater systems, pollution resulting from man-made sources, such as TCP, sea water incursion and possible third-party attacks, including physical attacks, terrorist attacks, and cyber attacks. If our water supply is contaminated, we may have to interrupt the use of that water supply until we are able to substitute the flow of water from an uncontaminated water source. In addition, we may incur significant costs in order to treat the contaminated source through expansion of our current treatment facilities, or development of new treatment methods. If we are unable to substitute water supply from an uncontaminated water source, or to adequately treat the contaminated water source in a cost-effective manner, there may be an adverse effect on our revenues, operating results and financial condition. The costs we incur to decontaminate a water source or an underground water system could be significant and may not be recoverable in rates. We could also be held liable for consequences arising out of human exposure to hazardous substances in our water supplies or other environmental damage. For example, private plaintiffs have the right to bring personal injury or other toxic tort claims arising from the presence of hazardous substances in our drinking water supplies. Our insurance policies may not be sufficient to cover the costs of these claims.
We have taken steps to increase security measures at our facilities and heighten employee awareness of threats to our water supply, to protect against third-party attacks, including physical attacks, terrorist attacks and cyber attacks. We have also tightened our security measures regarding the delivery and handling of certain chemicals used in our business. We have and will continue to bear increased costs for security precautions to protect our facilities, operations and supplies. These costs may be significant. Despite these tightened security measures, we may not be in a position to control the outcome of third-party attacks should they occur.
We depend upon our skilled and trained workforce to ensure water delivery. Were a pandemic to occur, we can give no assurance that we would be able to maintain sufficient human resources to ensure uninterrupted service in all of the districts that we serve.
If any of these catastrophic events were to occur, we can give no assurance that our emergency preparedness plans would be adequate and that we would respond effectively, which could result in public or employee harm.
Failure of critical elements of our infrastructure could result in interruption of service, damage to others, or injuries, and could adversely affect our business, operating results and financial condition.
We own physical infrastructure which was installed over a long period of time both underground and above-ground. This infrastructure is subject to potential failure due to age, operating conditions, or other unknown factors. Failure of any of our facilities could cause flooding, loss of service to our customers, contamination from chemicals we use in operations, or other damages.
We operate a dam. If the dam were to fail for any reason, we would lose a water supply and flooding likely would occur. Whether or not we were responsible for the dam's failure, we could be sued. We can give no assurance that we would be able to successfully defend such a suit.
We operate several water and wastewater treatment plants. If a major failure of these facilities were to occur, we would have an interruption in service, potential flooding, and could release potentially harmful material into the environment.
We operate over 7,000 miles of underground pipeline. Some failures of underground pipelines could release chemicals into the environment which have a negative impact on sensitive habitats.
24
We rely on our information technology ("IT") and a number of complex business systems to assist with the management of our business and customer and supplier relationships, and a disruption of these systems could adversely affect our business.
Our IT systems are an integral part of our business, and a serious disruption of our IT systems could significantly limit our ability to manage and operate our business efficiently, which, in turn, could cause our business and competitive position to suffer and adversely affect our results of operations. We depend on our IT systems to bill customers, process orders, provide customer service, manage construction projects, manage our financial records, track assets, remotely monitor certain of our plants and facilities and manage human resources, inventory and accounts receivable collections. Our IT systems also enable us to purchase products from our suppliers and bill customers on a timely basis, maintain cost-effective operations and provide service to our customers. Some of our mission and business critical IT systems are older, such as our SCADA (Supervisory Control and Data Acquisition) system. The steps we have taken to protect our IT systems may be insufficient to protect them from damage or interruption from:
•power loss, computer systems failures, and internet, telecommunications or data network failures;
•operator negligence or improper operation by, or supervision of, employees;
•physical and electronic loss of customer data due to security breaches, cyber attacks, misappropriation and similar events;
•computer viruses;
•intentional security breaches, hacking, denial of services actions, misappropriation of data, and similar events, including intentional cyber security breaches aimed at disrupting and interfering with water treatment processes; and
•earthquakes, floods, fires, mudslides and other natural disasters or physical attacks.
These events may result in physical and/or electronic loss of customer or financial data, security breaches, misappropriation and other adverse consequences, including liability or regulatory penalties under data privacy laws and regulations. In addition, the lack of redundancy for certain of our IT systems, including billing systems, could exacerbate the impact of any of these events on us.
In addition, we may not be successful in developing or acquiring technology that is competitive and responsive to the needs of our business, and we might lack sufficient resources to make the necessary upgrades or replacements of our outdated existing technology to allow us to continue to operate at our current level of efficiency.
The adequacy of our water supplies depends upon a variety of factors beyond our control. Interruption in the water supply may adversely affect our reputation and earnings.
We depend on an adequate water supply to meet the present and future needs of our customers. Whether we have an adequate supply varies depending upon a variety of factors, many of which are partially or completely beyond our control, including:
•the amount of rainfall;
•the amount of water stored in reservoirs;
•underground water supply from which well water is pumped;
•availability from water wholesalers;
•changes in the amount of water used by our customers;
•water quality and availability of appropriate treatment technology;
•legal limitations on water use such as rationing restrictions during a drought;
•changes in prevailing weather patterns and climate; and
•population growth.
25
We purchase our water supply from various governmental agencies and others. Water supply availability may be affected by weather conditions, funding and other political and environmental considerations. In addition, our ability to use surface water is subject to regulations regarding water quality and volume limitations. If new regulations are imposed or existing regulations are changed or given new interpretations, the availability of surface water may be materially reduced. A reduction in surface water could result in the need to procure more costly water from other sources, thereby increasing our water production costs and adversely affecting our operating results if not recovered in rates on a timely basis.
We have entered into long-term water supply agreements, which commit us to making certain minimum payments whether or not we purchase any water. Therefore, if demand is insufficient to use our required purchases we would have to pay for water we did not receive.
From time to time, we enter into water supply agreements with third parties and our business is dependent upon such agreements in order to meet regional demand. For example, we have entered into a water supply contract with the SFPUC that expires on June 30, 2034. We can give no assurance that the SFPUC, or any of the other parties from whom we purchase water, will renew our contracts upon expiration, or that we will not be subject to significant price increases under any such renewed contracts.
The parties from whom we purchase water maintain significant infrastructure and systems to deliver water to us. Maintenance of these facilities is beyond our control. If these facilities are not adequately maintained or if these parties otherwise default on their obligations to supply water to us, we may not have adequate water supplies to meet our customers' needs.
If we are unable to access adequate water supplies, we may be unable to satisfy all customer demand, which could result in rationing. Rationing may have an adverse effect on cash flow from operations. We can make no guarantee that we will always have access to an adequate supply of water that will meet all required quality standards. Water shortages may affect us in a variety of ways. For example, shortages could:
•adversely affect our supply mix by causing us to rely on more expensive purchased water;
•adversely affect operating costs;
•increase the risk of contamination to our systems due to our inability to maintain sufficient pressure; and
•increase capital expenditures for building pipelines to connect to alternative sources of supply, new wells to replace those that are no longer in service or are otherwise inadequate to meet the needs of our customers and reservoirs and other facilities to conserve or reclaim water.
We may or may not be able to recover increased operating and construction costs on a timely basis, or at all, for our regulated systems through the ratemaking process. Although we can give no assurance, we may be able to recover certain of these costs from third parties that may be responsible, or potentially responsible, for groundwater contamination.
Our water supplies and other aspects of our operations may be affected by climate change.
There is strong scientific consensus that human activity including carbon and methane emissions is impacting many planetary systems such as the heat-trapping capacity of the atmosphere; ocean temperature, circulation, acidity, and volume; weather patterns including the severity and frequency of severe weather events; ambient temperatures; and planetary ice cover. Because scientific investigations have been focused globally, there is tremendous uncertainty over the timing, extent, and types of impacts global climate change may have on our service areas and in our water supplies. Moreover, studies of tree ring data show long periods of drought conditions have occurred prior to significant human impacts in California and prior to our operation. Finally, in the last fifty years, California has experienced at least three severe multi-year droughts. Thus, we plan for water reliability and water shortages including projected and potential climate change risks in our water supply planning activities. Several anticipated impacts of climate change we consider in these plans which could impact our service areas are a greater percentage of state precipitation falling as rain rather than snow, changes in the frequency and volume of precipitation, hotter summer temperatures increasing demand for outdoor irrigation, and sea level rise increasing the likelihood of seawater intrusion into coastal aquifers. We also periodically review the climate change plans of our wholesalers to determine whether alternative supplies may be necessary in the future. However, we can give no assurance that replacement water supplies will be available at a reasonable cost or a cost acceptable to our customers and Commissions.
26
Natural disasters, climate change, and other factors may change the population in our service areas.
In the event that some outside factor such as a wildfire, flood, changed climate pattern, actual or threatened public health emergency or change in the local economy reduces or eliminates our customer base in a service area, we could face unrecoverable costs. In those circumstances the remaining customers might not be able to pay for the operating costs or capital costs of the water system. The company may not be able to recover capital costs of property which is no longer used and useful in utility service. Although we would likely seek permission to recover these costs through rate increases on remaining customers or in statewide rates, we can give no assurance that the Commissions would approve rate increases to enable us to recover these costs.
Wastewater operations entail significant risks.
Wastewater collection and treatment involve many risks associated with damage to the environment, and we anticipate that wastewater collection and treatment will become an increasing significant part of our business. If collection or treatment systems fail or do not operate properly, untreated or partially treated wastewater could discharge onto property or into nearby streams and rivers, causing property damage or injury to aquatic life, or even human life. Liabilities resulting from such damage could materially and adversely affect our results of operations and financial condition.
Demand for our water is subject to various factors and is affected by seasonal fluctuations.
Demand for our water during the warmer, dry months is generally greater than during cooler or rainy months due primarily to additional requirements for water in connection with irrigation systems, swimming pools, cooling systems and other outside water use. Throughout the year, and particularly during typically warmer months, demand will vary with temperature and rainfall levels. If temperatures during the typically warmer months are cooler than normal, or if there is more rainfall than normal, the demand for our water may decrease. Under the WRAM mechanism, lower water usage in our California operations impacts our cash flows in the year of usage, but results in higher cash flows in the following years.
In addition, governmental restrictions on water usage during drought conditions may result in a decreased demand for our water, even if our water reserves are sufficient to serve our customers during these drought conditions. The Commissions may not allow surcharges to collect lost revenues caused by customers' conservation during a drought. Regardless of whether we may surcharge our customers during a conservation period, they may use less water even after a drought has passed because of conservation patterns developed during the drought. Furthermore, our customers may wish to use recycled water as a substitute for potable water. If rights are granted to others to serve our customers recycled water, there will likely be a decrease in demand for our water.
Finally, changes in prevailing weather patterns due to climate change may affect customer demand. If increased ambient temperatures affect our service areas, water used for irrigation and cooling may increase. If rainfall patterns change, our customers may change their patterns of water use including the amount of outdoor irrigation and the type of landscape they install. Government agencies may also mandate changes to customer irrigation or landscape patterns in response to changes in weather and climate.
Changes in water supply costs impact our operations.
The cost to obtain water for delivery to our customers varies depending on the sources of supply, wholesale suppliers' prices, the quality of water required to be treated and the quantity of water produced to fulfill customer water demand. Our source of supply varies among our operating districts. Certain districts obtain all of their supply from wells; some districts purchase all of the supply from wholesale suppliers; and other districts obtain the supply from a combination of wells and wholesale suppliers. A small portion of supply comes from surface sources and is processed through Company-owned water treatment plants. On average, slightly more than half of the water we deliver to our customers is pumped from wells or received from a surface supply with the remainder purchased from wholesale suppliers. Water purchased from suppliers usually costs us more than surface supplied or well pumped water. The cost of purchased water for delivery to customers represented 35.0% and 34.5% of our total operating costs in 2020 and 2019, respectively. Water purchased from suppliers will require renewal of our contracts upon expiration and may result in significant price increases under any such renewed contracts.
Wholesale water suppliers may increase their prices for water delivered to us based on factors that affect their operating costs. Purchased water rate increases are beyond our control. In California, effective July 1, 2008, our ability to recover increases in the cost of purchased water changed with the adoption of the MCBA. With this change, actual purchased water costs are compared to authorized purchased water costs, with variances netted against the variances in purchased power, pump tax, and metered revenue, being recorded to revenue. The balance in the MCBA will be collected in the future by billing the net WRAM and MCBA accounts receivable balances over 12, 18, and 18+ month periods, which may have a short-term negative impact on cash flow.
27
Dependency upon adequate supply of electricity, certain chemicals, and third-party suppliers of parts and skilled labor could adversely affect our results of operations.
Purchased electrical power is required to operate the wells and pumps needed to supply water to our customers. Although there are back-up power generators to operate a number of wells and pumps in emergencies, an extended interruption in power could impact the ability to supply water. In the past, California has been subject to rolling power blackouts due to insufficient power supplies. There is no assurance we will not be subject to power blackouts in the future. Additionally, we require sufficient amounts of certain chemicals in order to treat the water we supply. There are multiple sources for these chemicals but an extended interruption of supply could adversely affect our ability to adequately treat our water.
Purchased power is a significant operating expense. During 2020 and 2019, purchased power expense represented 5.2% and 5.1%, respectively, of our total operating costs. These costs are beyond our control and can change unpredictably and substantially as occurred in California during 2001 when rates paid for electricity increased 48%. As with purchased water, purchased power costs are included in the MCBA. Cash flows between rate filings may be adversely affected until the Commission authorizes a rate change, but earnings will be minimally impacted. Cost of chemicals used in the delivery of water is not an element of the MCBA, and therefore, variances in quantity or cost could impact the results of operations.
We rely on outside contractors to supply us with materials and parts critical to the operation of our systems. Should parts and material become unavailable, or should the cost of necessary supplies rise substantially, it could adversely affect our ability to operate or have financial impacts which are not recoverable through a regulatory process.
We also rely on outside contractors to complete large construction projects and provide emergency maintenance services. In the event these contractors are unavailable or cannot meet the demands imposed on them, we may face significantly lengthy interruptions of service or delays in constructing capital projects. We may face additional costs to acquire more resources to complete these activities.
Our business requires significant capital expenditures to replace or improve aging infrastructure that are dependent on our ability to secure appropriate funding. If we are unable to obtain sufficient capital or if the rates at which we borrow increase, there would be a negative impact on our results of operations.
The water utility business is capital-intensive. We invest significant funds to replace or improve aging infrastructure such as property, plant and equipment. In addition, water shortages may adversely affect us by causing us to rely on more purchased water. This could cause increases in capital expenditures needed to build pipelines to secure alternative water sources. In addition, we require capital to grow our business through acquisitions. We fund our short-term capital requirements from cash received from operations and funds received from developers. We also borrow funds from banks under short-term bank lending arrangements. We seek to meet our long-term capital needs by raising equity through common or preferred stock issues or issuing debt obligations. We cannot give any assurance that these sources will continue to be adequate or that the cost of funds will remain at levels permitting us to earn a reasonable rate of return. In the event we are unable to obtain sufficient capital, our expansion efforts could be curtailed, which may affect our growth and may affect our future results of operations.
Our ability to access the capital markets is affected by the ratings of certain of our debt securities. Standard & Poor's Rating Agency issues a rating on California Water Service Company's ability to repay certain debt obligations. The credit rating agency could downgrade our credit rating based on reviews of our financial performance and projections or upon the occurrence of other events that could impact our business outlook. Lower ratings by the agency could restrict our ability to access equity and debt capital. We can give no assurance that the rating agency will maintain ratings which allow us to borrow under advantageous conditions and at reasonable interest rates. A future downgrade by the agency could also increase our cost of capital by causing potential investors to require a higher interest rate due to a perceived risk related to our ability to repay outstanding debt obligations.
While the majority of our debt is long term at fixed rates, we do have interest rate exposure in our short-term borrowings which have variable interest rates. We are also subject to interest rate risks on new financings. However, if interest rates were to increase on a long-term basis, our management believes that customer rates would increase accordingly, subject to approval by the appropriate commission. We can give no assurance that the Commission would approve such an increase in customer rates.
We are obligated to comply with specified debt covenants under certain of our loan and debt agreements. Failure to maintain compliance with these covenants could limit future borrowing, and we could face increased borrowing costs, litigation, acceleration of maturity schedules, and cross default issues. Such actions by our creditors could have a material adverse effect on our financial condition and results of operations.
28
Our inability to access the capital or financial markets could affect our ability to meet our liquidity needs at reasonable cost and our ability to meet long-term commitments. Changes in economic conditions in our markets could affect our customers' ability to pay for water services. Any of these could adversely affect our results of operations, cash flows and financial condition.
We rely on our current credit facilities to fund short-term liquidity needs if internal funds are not available from operations. Specifically, given the seasonal fluctuations in demand for our water we commonly draw on our credit facilities to meet our cash requirements at times in the year when demand is relatively low. We also may occasionally use letters of credit issued under our revolving credit facilities. Disruptions in the capital and credit markets could adversely affect our ability to draw on our credit facilities. Our access to funds under our credit facilities is dependent on the ability of our banks to meet their funding commitments.
Many of our customers and suppliers also have exposure to risks that could affect their ability to meet payment and supply commitments. We operate in geographic areas that may be particularly susceptible to declines in the price of real property, which could result in significant declines in demand for our products and services. In the event that any of our significant customers or suppliers, or a significant number of smaller customers and suppliers, are adversely affected by these risks, we may face disruptions in supply, significant reductions in demand for our products and services, inability of customers to pay invoices when due, and other adverse effects that could negatively affect our financial condition, results of operations and/or cash flows.
Our operations and certain contracts for water distribution and treatment depend on the financial capability of state and local governments, and other municipal entities such as water districts. Major disruptions in the financial strength or operations of such entities, such as liquidity limitations, bankruptcy or insolvency, could have an adverse effect on our ability to conduct our business and/or enforce our rights under contracts to which such entities are a party.
We are a holding company that depends on cash flow from our subsidiaries to meet our obligations and to pay dividends on our common stock.
As a holding company, we conduct substantially all of our operations through our subsidiaries and our only significant assets are investments in those subsidiaries. 93.8% of our revenues are derived from the operations of California Water Service Company. As a result, we are dependent on cash flow from our subsidiaries, and California Water Service Company in particular, to meet our obligations and to pay dividends on our common stock.
Our subsidiaries are separate and distinct legal entities and generally have no obligation to pay any amounts due on California Water Service Group's debt or to provide California Water Service Group with funds for dividends. Although there are no contractual or regulatory restrictions on the ability of our subsidiaries to transfer funds to us, the reasonableness of our capital structure is one of the factors considered by state and local regulatory agencies in their ratemaking determinations. Therefore, transfer of funds from our subsidiaries to us for the payment of our obligations or dividends may have an adverse effect on ratemaking determinations. Furthermore, our right to receive cash or other assets upon the liquidation or reorganization of a subsidiary is generally subject to the prior claims of creditors of that subsidiary. If we are unable to obtain funds from our subsidiaries in a timely manner, we may be unable to meet our obligations or pay dividends.
We can make dividend payments only from our surplus (the excess, if any, of our net assets over total paid-in capital) or if there is no surplus, the net profits for the current fiscal year or the fiscal year before which the dividend is declared. In addition, we can pay cash dividends only if after paying those dividends we would be able to pay our liabilities as they become due. Owners of our capital stock cannot force us to pay dividends and dividends will only be paid if and when declared by our board of directors. Our board of directors can elect at any time, and for an indefinite duration, not to declare dividends on our capital stock.
An important element of our growth strategy is the acquisition of water and wastewater systems. Risks associated with potential acquisitions, divestitures or restructurings may adversely affect us.
We may seek to acquire or invest in other companies, technologies, services or products that complement our business. The execution of our growth strategy may expose us to different risks than those associated with our utility operations. We can give no assurance that we will succeed in finding attractive acquisition candidates or investments, or that we would be able to reach mutually agreeable terms with such parties. In addition, as consolidation becomes more prevalent in the water and wastewater industries, the prices for suitable acquisition candidates may increase to unacceptable levels and limit our ability to grow through acquisitions. If we are unable to find acquisition candidates or investments, our ability to grow may be limited.
29
Acquisition and investment transactions may result in the issuance of our equity securities that could be dilutive if the acquisition or business opportunity does not develop in accordance with our business plan. They may also result in significant write-offs and an increase in our debt. The occurrence of any of these events could have a material adverse effect on our business, financial condition and results of operations.
Any of these transactions could involve numerous additional risks, including one or more of the following:
•problems integrating the acquired operations, personnel, technologies, physical and cyber security processes, or products with our existing businesses and products;
•liabilities inherited from the acquired companies' prior business operations;
•diversion of management time and attention from our core business to the acquired business;
•failure to retain key technical, management, sales and other personnel of the acquired business;
•difficulty in retaining relationships with suppliers and customers of the acquired business; and
•difficulty in obtaining required regulatory approvals.
In addition, the businesses and other assets we acquire may not achieve the sales and profitability expected. The occurrence of one or more of these events may have a material adverse effect on our business. There can be no assurance that we will be successful in overcoming these or any other significant risks encountered.
We may not be able to increase or sustain our recent growth rate, and we may not be able to manage our future growth effectively.
We may be unable to continue to expand our business or manage future growth. To successfully manage our growth and handle the responsibilities of being a public company, we must effectively:
•hire, train, integrate and manage additional qualified engineers for engineering design and construction activities, new business personnel, and financial and information technology personnel;
•retain key management, augment our management team, and retain qualified and certified water and wastewater system operators;
•implement and improve additional and existing administrative, financial and operations systems, procedures and controls;
•expand our technological capabilities; and
•manage multiple relationships with our customers, regulators, suppliers and other third parties.
If we are unable to manage our growth effectively, we may not be able to take advantage of market opportunities, satisfy customer requirements, execute our business plan or respond to competitive pressures.
We have a number of large-volume commercial and industrial customers and a significant decrease in consumption by one or more of these customers could have an adverse effect on our operating results and cash flows.
Our billed revenues and cash flows from operations will decrease if a significant business or industrial customer terminates or materially reduces its use of our water. Approximately $154.9 million, or 22.2%, of our 2020 water utility revenues was derived from business and industrial customers. However, if any of our large business or industrial customers in California reduce or cease its consumption of our water, the impact to net operating income would be minimal to our operations due to the WRAM and MCBA, but could impact our cash flows. In Hawaii, we serve a number of large resorts which if their water usage was reduced or ceased could have a material impact to our Hawaii operation. The delay between such date and the effective date of the rate relief may be significant and could adversely affect our operating results and cash flows.
Our operating cost and costs of providing services may rise faster than our revenues.
Our ability to increase rates over time is dependent upon approval of such rate increases by the Commissions, or in the case of the City of Hawthorne and the City of Commerce, the City Council, which may be inclined, for political or other reasons, to limit rate increases. However, our costs, which are subject to market conditions and other factors, may increase significantly. The second largest component of our operating costs after water production is made up of salaries and wages. These costs are affected by the local supply and demand for qualified labor. Other large components of our costs are general insurance, workers compensation insurance, employee benefits and health insurance costs. These costs may increase disproportionately to rate increases authorized by the Commissions and may have a material adverse effect on our future results of operations.
30
Demand for our stock may fluctuate due to circumstances beyond our control.
We believe that stockholders invest in public utility stocks, in part, because they seek reliable dividend payments. If there is an over-supply of stock of public utilities in the market relative to demand by such investors, the trading price of our securities could decrease. Additionally, if interest rates rise above the dividend yield offered by our equity securities, demand for our stock, and consequently its market price, may also decrease. A decline in demand for our stock may have a negative impact on our ability to finance capital projects.
Adverse investment returns and other factors may increase our pension liability and pension funding requirements.
A substantial number of our employees are covered by a defined benefit pension plan. At present, the pension plan is underfunded because our projected pension benefit obligation exceeds the aggregate fair value of plan assets. Under applicable law, we are required to make cash contributions to the extent necessary to comply with minimum funding levels imposed by regulatory requirements. The amount of such required cash contribution is based on an actuarial valuation of the plan. The funded status of the plan can be affected by investment returns on plan assets, discount rates, mortality rates of plan participants, pension reform legislation and a number of other factors. There can be no assurance that the value of our pension plan assets will be sufficient to cover future liabilities. Although we have made contributions to our pension plan in recent years, it is possible that we could incur a pension liability adjustment, or could be required to make additional cash contributions to our pension plan, which would reduce the cash available for business and other needs.
Labor relations matters could adversely affect our operating results.
At December 31, 2020, 743 of our 1,192 total employees were union employees. Most of our unionized employees are represented by the Utility Workers Union of America, AFL-CIO, except certain engineering and laboratory employees who are represented by the International Federation of Professional and Technical Engineers, AFL-CIO.
We believe our labor relations are good, but in light of rising costs for health care and pensions, our current contract negotiations and those in the future may be difficult. Furthermore, changes in applicable law or regulations could have an adverse effect on management's negotiating position with respect to our currently unionized employees and/or employees that decide to unionize in the future. We are subject to a risk of work stoppages and other labor relations matters as we negotiate with the unions to address these issues, which could affect our results of operations and financial condition. We can give no assurance that issues with our labor forces will be resolved favorably to us in the future or that we will not experience work stoppages.
Our operations are geographically concentrated in California and this lack of diversification may negatively impact our operations.
Although we own facilities in a number of states, over 93.8% of our operations are located in California. As a result, we are largely subject to weather, political, water supply, labor, energy cost, regulatory and economic risks affecting California.
We are also affected by the real property market in California. In order to grow our business, we may need to acquire additional real estate or rights to use real property owned by third parties, the cost of which tends to be higher and more volatile in California than in other states. The value of our assets in California may decline if there is a decline in the California real estate market which results in a significant decrease in real property values.
Municipalities, water districts and other public agencies may condemn our property by eminent domain action.
State statutes allow municipalities, water districts and other public agencies to own and operate water systems. These agencies are empowered to condemn water systems or real property owned by privately owned public utilities in certain circumstances and in compliance with California and federal law. Additionally, whenever a public agency constructs facilities to extend its utility system into the service area of a privately owned public utility, such an act may constitute the taking of property and require reimbursement to the public utility for its loss. If a public agency were to file an eminent domain lawsuit against us, we would incur substantial attorney’s fees, consultant and expert fees and other costs in considering a challenge to the right to take our utility property and/or its valuation for just compensation, as well as such fees and costs in any subsequent litigation if necessary. If the public agency prevailed and acquired our utility property, we would be entitled to just compensation for our loss, but we would no longer have access to the condemned property or water system. Neither would we be entitled to any portion of revenue generated from the use of such asset going forward.
31
General Risk Factors
We depend significantly on the services of the members of our management team, and the departure of any of those persons could cause our operating results to suffer.
Our success depends significantly on the continued individual and collective contributions of our management team. The loss of the services of any member of our management team could have an adverse effect on our business as our management team has knowledge of our industry and customers and would be difficult to replace.
We retain certain risks not covered by our insurance policies.
We evaluate our risks and insurance coverage annually or more frequently if circumstances dictate. Our evaluation considers the costs, risks and benefits of retaining versus insuring various risks as well as the availability of certain types of insurance coverage. Furthermore, we are also affected by increases in prices for insurance coverage; in particular, we have been, and will continue to be, affected by rising health insurance costs. Retained risks are associated with deductible limits, partial self-insurance programs and insurance policy coverage ceilings. If we suffer an uninsured loss, we may be unable to pass all, or any portion, of the loss on to customers because our rates are regulated by regulatory commissions. Consequently, uninsured losses may negatively affect our financial condition, liquidity and results of operations. There can be no assurance that we will not face uninsured losses pertaining to the risks we have retained.
Our enterprise risk management processes may not be effective in identifying and mitigating the risks to which we are subject, or in reducing the potential for losses in connection with such risks.
Our enterprise risk management processes are designed to minimize or mitigate the risks to which we are subject, as well as any losses stemming from such risks. Although we seek to identify, measure, monitor, report, and control our exposure to such risks, and employ a broad and diversified set of risk monitoring and mitigation techniques in the process, those techniques are inherently limited in their ability to anticipate the existence or development of risks that are currently unknown and unanticipated. The ineffectiveness of our enterprise risk management processes in mitigating the impact of known risks or the emergence of previously unknown or unanticipated risks may result in our incurring losses in the future that could adversely impact our financial condition and results of operations.
The accuracy of our judgments and estimates about financial and accounting matters will impact our operating results and financial condition.
We make certain estimates and judgments in preparing our financial statements regarding, among others:
•the useful life of intangible rights;
•the number of years to depreciate certain assets;
•amounts to set aside for uncollectible accounts receivable, inventory obsolescence and uninsured losses;
•our legal exposure and the appropriate accrual for claims, including medical claims and workers' compensation claims;
•future costs and assumptions for pensions and other postretirement benefits;
•regulatory recovery of regulatory assets;
•possible tax uncertainties; and
•projected collections of WRAM and MCBA receivables.
The quality and accuracy of those estimates and judgments will have an impact on our operating results and financial condition.
In addition, we must estimate unbilled revenues and costs as of the end of each accounting period. If our estimates are not accurate, we will be required to make an adjustment in a future period. Accounting rules permit us to use expense balancing accounts and memorandum accounts that include cost changes to us that are different from amounts incorporated into the rates approved by the Commissions. These accounts result in expenses and revenues being recognized in periods other than in which they occurred.
Item 1B. Unresolved Staff Comments.
None.
32
Item 2. Properties.
Our physical properties consist of offices and water facilities to accomplish the production, storage, treatment, and distribution of water. These properties are located in or near the geographic service areas listed above in Item 1, "Business—Geographical Service Areas and Number of Customer Connections at Year-end." Our headquarters, which houses accounting, engineering, information systems, human resources, purchasing, regulatory, water quality, and executive staff, is located in San Jose, California.
The real properties owned are held in fee simple title. Properties owned by Cal Water are subject to the lien of an Indenture of Mortgage and Deed of Trust dated June 11, 2019, March 16, 2016, October 13, 2015, November 22, 2010, and April 17, 2009 (the California Indenture), securing Cal Water's First Mortgage Bonds, of which $780.0 million was outstanding at December 31, 2020. The California Indenture contains certain restrictions common to such types of instruments regarding the disposition of property and includes various covenants and restrictions. At December 31, 2020, our California utility was in compliance with the covenants of the California Indenture.
Cal Water owns 601 wells and operates ten leased wells. There are 449 owned storage tanks with a capacity of 295 million gallons, two leased storage tanks with a capacity of 0.4 million gallons, 30 managed storage tanks with a capacity of 32.4 million gallons, and three surface water reservoirs with a capacity of 220 million gallons. Cal Water owns and operates six surface water treatment plants with a combined capacity of 46 million gallons per day. There are 6,657 miles of supply and distribution mains in the various owned and managed systems.
In the leased City of Hawthorne and City of Commerce systems or in systems that are operated under contract for municipalities or private companies, title to the various properties is held exclusively by the municipality or private company.
Hawaii Water owns 23 wells and manages five irrigation wells. There are 26 storage tanks with a storage capacity of 22.1 million gallons. There are 140 miles of supply and distribution lines. Hawaii Water operates five wastewater treatment facilities with a combined capacity to process approximately 2.1 million gallons per day. There are 44 miles of sewer collection mains including force mains.
Washington Water owns 440 wells and manages five wells. There are 202 owned storage tanks and five managed storage tanks with a storage capacity of 22.5 million gallons. There are 704 miles of supply and distribution lines.
New Mexico Water owns 25 wells. There are 18 storage tanks with a storage capacity of 5.1 million gallons. There are 145 miles of supply and distribution lines. New Mexico operates two wastewater treatment facilities with a combined capacity to process 0.62 million gallons per day. There are eight life stations and 35 miles of sewer collection mains.
Washington Water has long-term bank loans that are secured primarily by utility plant owned by Washington Water.
Item 3. Legal Proceedings.
Information with respect to this item may be found under the subheading "Commitments and Contingencies" in Note 15 to the consolidated Financial Statements in Item 8, which is incorporated herein by reference.
Item 4. Mine Safety Disclosures.
Not applicable.
PART II
Item 5. Market for Registrant's Equity, Related Stockholder Matters and Issuer Purchases of Equity Securities.
Our common stock is traded on the New York Stock Exchange under the symbol "CWT." At December 31, 2020, there were 50,333,655 common shares outstanding. There were 1,941 common stockholders of record as of February 8, 2021.
During 2020, we paid a cash dividend of $0.8500 per common share, or $0.2125 per quarter. During 2019, we paid a cash dividend of $0.7900 per common share, or $0.1975 per quarter. On January 27, 2021, our Board of Directors declared a quarterly cash dividend of $0.2300 per common share payable on February 19, 2021, to stockholders of record on February 8, 2021. This represents an indicated annual cash dividend of $0.9200, and would be our 54th consecutive year of increasing the annual dividend and marks the 304th consecutive quarterly dividend.
We presently intend to pay quarterly cash dividends in the future consistent with past practices, subject to our earnings and financial condition, restrictions set forth in our debt instruments, regulatory requirements and such other factors as our Board of Directors may deem relevant.
33
Five-Year Performance Graph
The following performance graph compares the changes in the cumulative shareholder return on California Water Service Group's common stock with the cumulative total return on the Robert W. Baird Water Utility Index and the Standard & Poor's 500 Index during the last five years ended December 31, 2020. The comparison assumes $100 was invested on December 31, 2015, in California Water Service Group's common stock and in each of the forgoing indices and assumes reinvestment of dividends.
Performance Graph Data
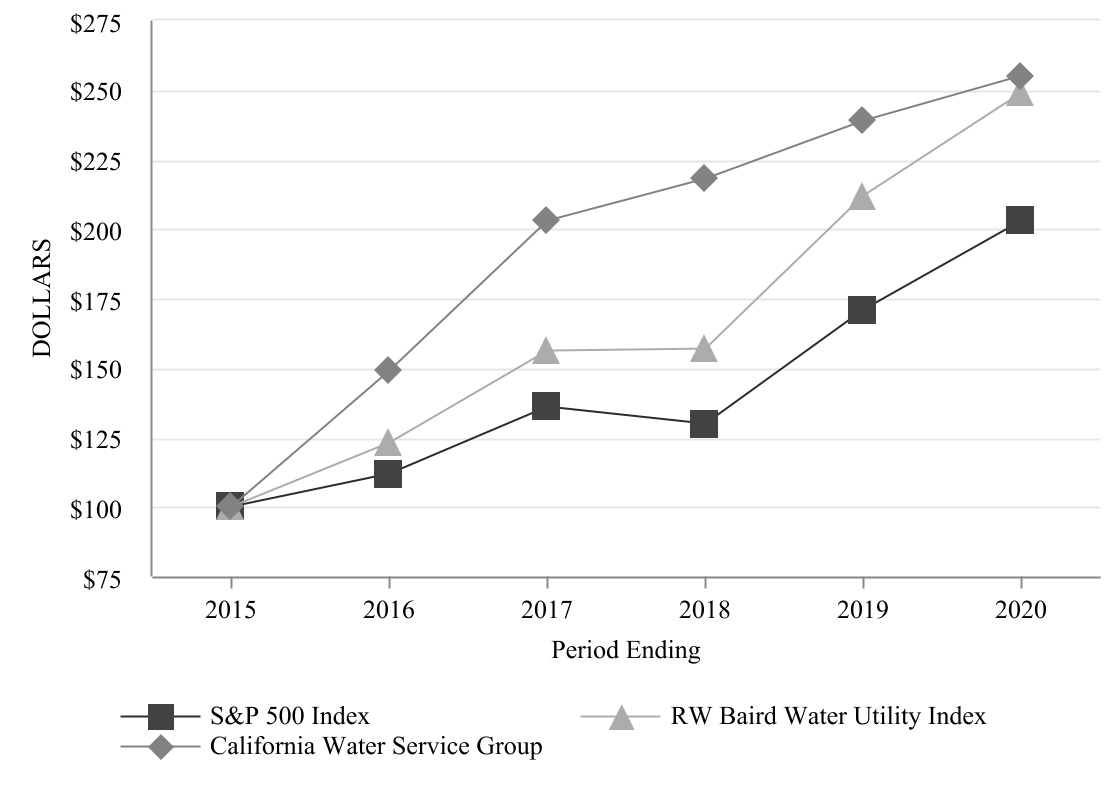
The following descriptive data is supplied in accordance with Rule 304(d) of Regulations S-T:
| 2015 | 2016 | 2017 | 2018 | 2019 | 2020 | ||||||||||||||||||||||||||||||
| California Water Service Group | 100 | 149 | 203 | 218 | 239 | 255 | |||||||||||||||||||||||||||||
| S&P 500 | 100 | 112 | 136 | 130 | 171 | 203 | |||||||||||||||||||||||||||||
| RW Baird Water Utility Index | 100 | 123 | 156 | 157 | 212 | 249 | |||||||||||||||||||||||||||||
An initial $100 investment in the common stock of California Water Service Group on December 31, 2015 including reinvestment of dividends would be worth $255 at the end of the 5-year period ending December 31, 2020.
Item 6. Selected Financial Data.
None.
34
Item 7. Management's Discussion and Analysis of Financial Condition and Results of Operations.
The following sections include a discussion of results for fiscal 2020 compared to fiscal 2019 as well as certain 2018 results. The comparative results for fiscal 2019 with fiscal 2018 generally have not been included in this Form 10-K, but may be found in “Part II - Item 7. Management’s Discussion and Analysis of Financial Condition and Results of Operations” of the Company’s Annual Report on Form 10-K for the year ended December 31, 2019.
Overview
Net Income
In 2020 and 2019, net income was $96.8 million and $63.1 million, respectively. Earnings per diluted common share increased $0.66 to $1.97 or 50.4% from 2019 to 2020. The $33.7 million increase in net income was driven primarily by the adoption of Cal Water’s 2018 GRC which increased operating revenue by $40.9 million and other general rate increases of $11.5 million, $4.5 million of which was related to increased water costs. In addition, net income increased $5.5 million due to an increase in income tax benefits from “repairs” deductions. These positive factors to net income were partially offset by increases in depreciation and amortization expenses of $9.3 million, employee wages of $4.7 million, bad debt reserve expenses of $4.1 million, outside consulting service costs of $2.1 million, and uninsured loss costs of $1.7 million which was partially offset by a decrease in travel costs of $1.6 million.
Additionally, certain factors outside the Company's immediate control decreased net income, including a $2.3 million reduction in accrued unbilled revenue and $0.8 million decrease in unrealized gain on certain benefit plan investments as compared to the prior year. Seasonal weather patterns and the number of unbilled days are the primary influences of the accrued unbilled revenue value.
We plan to continue to seek rate relief to recover our operating cost increases and receive reasonable returns on invested capital. We expect to fund our long-term capital needs through a combination of debt, common stock offerings, and cash flow from operations.
COVID-19
During the course of 2020, as a result of the COVID-19 pandemic, shelter-in-place and social distancing ordinances of varying durations and scope were implemented in all of the states in which we operate. Such governmental orders resulted in temporary closures of non-essential businesses and self-quarantining on non-essential workers. As an “essential business” during times of emergencies pursuant to the U.S. Critical Infrastructures Protection Act of 2001, we are working to continue to provide high quality water and wastewater services to our two million customers. Although the COVID-19 pandemic did not have a significant impact on our business during 2020, we have increased our allowance for credit losses as we have ceased all shutoffs for non-payment during the pandemic and anticipate this situation will continue until further notice. We are expecting segments of our customer base to continue to experience employment layoffs and business closures that negatively impact their ability to pay utility bills. We have also incurred costs to promote the health and safety of our employees and facilities.
If we need to close any of our facilities due to outbreaks of COVID-19 or if a critical number of our employees become too ill to work, our business operations could be materially adversely affected in a rapid manner. The impact of the COVID-19 pandemic is fluid and continues to evolve, and therefore, we cannot predict the extent to which our business, results of operations, financial condition or liquidity will ultimately be impacted.
Critical Accounting Policies and Estimates
We maintain our accounting records in accordance with accounting principles generally accepted in the United States of America and as directed by the Commissions to which our operations are subject. The process of preparing financial statements requires the use of estimates on the part of management. The estimates used by management are based on historic experience and an understanding of current facts and circumstances. A summary of our significant accounting policies is listed in Note 2 of the Notes to Consolidated Financial Statements. The following sections describe those policies where the level of subjectivity, judgment, and variability of estimates could have a material impact on the financial condition, operating performance, and cash flows of the business.
35
Revenue Recognition
Revenue from contracts with customers
The Company principally generates operating revenue from contracts with customers by providing regulated water and wastewater services at tariff-rates authorized by the Commissions in the states in which they operate and non-regulated water and wastewater services at rates authorized by contracts with government agencies. Revenue from contracts with customers reflects amounts billed for the volume of consumption at authorized per unit rates, for a service charge, and for other authorized charges.
The Company satisfies its performance obligation to provide water and wastewater services over time as services are rendered. The Company applies the invoice practical expedient and recognizes revenue from contracts with customers in the amount for which the Company has a right to invoice. The Company has a right to invoice for the volume of consumption, for the service charge, and for other authorized charges. The measurement of sales to customers is generally based on the reading of their meters, which occurs on a systematic basis throughout the month.
Contract terms are generally short-term and at will by customers and, as a result, no separate financing component is recognized for the Company's collections from customers, which generally require payment within 30 days of billing. The Company applies judgment, based principally on historical payment experience, in estimating its customers’ ability to pay.
Certain customers are not billed for volumetric consumption, but are instead billed a flat rate at the beginning of each monthly service period. The amount billed is initially deferred and subsequently recognized over the monthly service period, as the performance obligation is satisfied. The deferred revenue balance or contract liability, which is included in "other accrued liabilities" on the consolidated balance sheets, is inconsequential.
Regulatory balancing account revenue
The Company’s ability to recover revenue requirements authorized by the CPUC in its triennial GRC, is decoupled from the volume of the sales. Regulatory balancing account revenue is revenue related to rate mechanisms authorized in California by the CPUC, which allow the Company to recover the authorized revenue and are not considered contracts with customers. These mechanisms include the following:
The Water Revenue Adjustment Mechanism (WRAM) allows the Company to recognize the adopted level of volumetric revenues. The variance between adopted volumetric revenues and actual billed volumetric revenues for metered accounts is recorded as regulatory balancing account revenue.
Cost-recovery rates, such as the Modified Cost Balancing Account (MCBA), Conservation Balancing Account (CEBA), Pension Cost Balancing Account (PCBA), and Health Cost Balancing Account (HCBA), provide for recovery of the adopted levels of expenses for purchased water, purchased power, pump taxes, water conservation program costs, pension, and health care. Variances between adopted and actual costs are recorded as regulatory balancing account revenue.
As a result of the delay in the approval of the 2018 GRC, the CPUC authorized Cal Water to track the effect of the delay on customer billings in IRMA effective January 1, 2020. Variances between actual customer billings and those that would have been billed assuming the GRC had been effective January 1, 2020 are recorded as regulatory balancing account revenue. The 2018 GRC was approved in December of 2020 and final rates for the 2018 GRC were not implemented in 2020; as a result. Cal Water calculated and recorded this difference for all of 2020. In 2020, Cal Water determined that the IRMA met regulatory asset recognition criteria under accounting standards for regulated utilities.
Each district's WRAM and MCBA regulatory assets and liabilities are allowed to be netted against one another. The Company recognizes regulatory balancing account revenues that have been authorized for rate recovery, are objectively determinable and probable of recovery, and are expected to be collected within 24 months. To the extent that regulatory balancing account revenue is estimated to be collectible beyond 24 months, recognition is deferred.
Regulated Utility Accounting
Because we operate almost exclusively in a regulated business, we are subject to the accounting standards for regulated utilities. The Commissions in the states in which we operate establish rates that are designed to permit the recovery of the cost of service and a return on investment. We capitalize and record regulatory assets for costs that would otherwise be charged to expense if it is probable that the incurred costs will be recovered in future rates. Regulatory assets are amortized over the future periods that the costs are expected to be recovered. If costs expected to be incurred in the future are currently being recovered through rates, we record those expected future costs as regulatory liabilities. In addition, we record regulatory liabilities when the Commissions require a refund to be made to our customers over future periods.
36
Determining probability requires significant judgment by management and includes, but is not limited to, consideration of testimony presented in regulatory hearings, proposed regulatory decisions, final regulatory orders, and the strength or status of applications for rehearing or state court appeals.
If we determine that a portion of our assets used in utility operations is not recoverable in customer rates, we would be required to recognize the loss of the assets disallowed.
Income Taxes
We account for income taxes using the asset and liability method. Deferred tax assets and liabilities are recognized for future tax consequences attributable to differences between the financial statement carrying amounts of existing assets and liabilities and their respective tax basis. We measure deferred tax assets and liabilities at enacted tax rates expected to apply to taxable income in the years in which those temporary differences are expected to be recovered or settled. We recognize the effect on the deferred tax assets and liabilities of a change in tax rate in the period that includes the enactment date. We also assess the likelihood that deferred tax assets will be recovered in future taxable income and, to the extent recovery is not probable, a valuation allowance would be recorded. In management's view, a valuation allowance was not required as of December 31, 2020 and December 31, 2019.
We anticipate that future rate actions by the regulatory commissions will reflect revenue requirements for the tax effects of temporary differences recognized, which have previously been passed through to customers. The regulatory commissions have granted the Company permission to reflect the normalization of the tax benefits of the federal accelerated methods and available Investment Tax Credits (ITCs) for all assets placed in service after 1980. ITCs are deferred and amortized over the lives of the related properties for book purposes. The CPUC requires flow through accounting for state deferred taxes.
On December 22, 2017, the Tax Cuts and Jobs Act (TCJA) was enacted. Based on accounting principles generally accepted in the United States of America, the Company is required to re-measure deferred income taxes to reflect the corporate income tax rate change from 35 percent to 21 percent as of the date of enactment. The re-measurement of the deferred income taxes resulted in an estimated excess deferred income tax liability of $105.0 million as of December 31, 2020. The TCJA lowered ratepayers' rates due to lower income tax expense recoveries and resulted in the quantification of excess deferred income tax balances collected from ratepayers. The Company is working with state regulators on the refund process for excess deferred income taxes collected from ratepayers in prior years that complies with the federal income tax normalization rules. There are aspects to the TCJA that contain technical matters that require management to interpret the legislation and make judgments until further guidance becomes available. As a result, changes in management’s judgments could materially affect amounts recognized in the financial statements.
Pension and Postretirement Health Care Benefits
We incur costs associated with our pension and postretirement health care benefits plans. To measure the expense of these benefits, our management must estimate compensation increases, mortality rates, future health cost increases and discount rates used to value related liabilities and to determine appropriate funding. Different estimates used by our management could result in significant variances in the cost recognized for pension and postretirement health care benefit plans. The estimates used are based on historical experience, current facts, future expectations, and recommendations from independent advisors and actuaries. We use an investment advisor to provide advice in managing the plan's investments. We anticipate any increases in funding for the pension benefits plans will be recovered in future rate filings, thereby mitigating the financial impact. We believe it is probable that future costs will be recovered in future rates and therefore have recorded a regulatory asset in accordance with generally accepted accounting principles.
37
Changes to the pension benefits actuarial assumptions can significantly affect pension costs, regulatory assets, and liabilities. The following table reflects the sensitivity of pension amounts reported for the year ended December 31, 2020, to changes in actuarial assumptions:
| Increase/(Decrease) in Pension Benefits Actuarial Assumption |
Increase/(Decrease) in 2020 Net Periodic Benefit Cost |
Increase/(Decrease) in Projected Benefit Obligation as of December 31, 2020 |
|||||||||||||||
| Dollars in thousands | |||||||||||||||||
| Discount rate | (0.5) | % | $ | 9,173 | $ | 83,741 | |||||||||||
| Long-term rate of return on plan assets | (0.5) | % | 3,035 | — | |||||||||||||
| Rate of compensation increases | (0.5) | % | (4,373) | (22,083) | |||||||||||||
| Cost of living adjustment (1) | (0.1) | % | (1,477) | (9,772) | |||||||||||||
| Discount rate | 0.5 | % | (7,796) | (72,998) | |||||||||||||
| Long-term rate of return on plan assets | 0.5 | % | (3,035) | — | |||||||||||||
| Rate of compensation increases | 0.5 | % | 4,695 | 23,454 | |||||||||||||
| Cost of living adjustment | 0.5 | % | 8,152 | 53,615 | |||||||||||||
_______________________________________________________________________________
1.The cost of living adjustment was assumed to be 2.1% and has a floor of 2.0%.
Results of Operations
Operating Revenue
Operating revenue in 2020 was $794.3 million, an increase of $79.7 million, or 11.2%, over 2019. Operating revenue in 2019 was $714.6 million, an increase of $16.4 million, or 2.3%, over 2018. The sources of changes in operating revenue were:
| 2020 | 2019 | ||||||||||
| Dollars in millions | |||||||||||
| Net change due to WRAM, service charges, usage, and other (1) | $ | 29.2 | $ | 23.1 | |||||||
| MCBA revenue (2) | 46.8 | (5.3) | |||||||||
| Other balancing account revenue (3) | (1.0) | 3.8 | |||||||||
| Deferral of revenue (4) | 4.7 | (5.2) | |||||||||
| Net change | $ | 79.7 | $ | 16.4 | |||||||
_______________________________________________________________________________
(1)In 2020, the net change due to rate changes, usage, and other in the above table was mainly driven by rate increases (the components of which are set forth in the table in Rates and Regulation section below) and a $5.0 million increase from the billings related to acquired customers from Rainier View Water Company. This was partially offset by a $2.3 million decrease in accrued unbilled revenue.
(2)MCBA revenue is the variance between adopted water production costs and actual water production costs. In 2020, we recognized $11.7 million of MCBA revenue as compared to a decrease to revenue of $35.1 million in 2019. The MCBA revenue increase in 2020 as compared to 2019 resulted from an increase in actual water production costs relative to adopted water production costs. The actual water production costs increased relative to adopted water production costs in 2020 as compared to 2019 due to a shift in water production mix from well water to purchased water in certain of our service territories. As required by the MCBA mechanism, the increase in actual water production costs relative to adopted water production costs in California also increased operating revenue for the same amount.
(3)The other balancing account revenue consists of the pension, conservation and health care balancing account revenues. Pension and conservation balancing account revenues are the differences between actual expenses and adopted rate recovery. Health care balancing account revenue is 85% of the difference between actual health care expenses and adopted rate recovery. In 2020, we recognized net revenue of $7.4 million for these balancing accounts as compared to a net $8.4 million of revenue in 2019. The decrease in revenue was mainly due to a decrease in actual conservation and health care expenses relative to adopted in 2020 as compared to 2019, which was partially offset by an increase in actual pension expenses relative to adopted in 2020 as compared to 2019.
38
(4)The deferral of revenue consists of amounts that are expected to be collected from customers beyond 24 months following the end of the accounting period in which these revenues were recorded. The deferral decreased in 2020 as compared to 2019 due to a decrease in the balancing account revenue expected to be collected beyond 24 months.
Water Production Expenses
Water production expenses, which consist of purchased water, purchased power, and pump taxes, comprise the largest segment of total operating expenses. Water production costs accounted for 42.1% and 41.5%, of total operating costs in 2020 and 2019, respectively. The rates charged for wholesale water supplies, electricity, and pump taxes are established by various public agencies. As such, these rates are beyond our control.
The table below provides the change in water production expenses during the past 2 years:
| 2020 | 2019 | ||||||||||||||||||||||||||||||||||
| Amount | Change | % Change | Amount | Change | % Change | ||||||||||||||||||||||||||||||
| Dollars in millions | |||||||||||||||||||||||||||||||||||
| Purchased water | $ | 230.1 | $ | 17.6 | 8.3 | % | $ | 212.5 | $ | 5.4 | 2.6 | % | |||||||||||||||||||||||
| Purchased power | 34.0 | 2.6 | 8.3 | % | 31.4 | 0.3 | 1.0 | % | |||||||||||||||||||||||||||
| Pump taxes | 12.6 | 1.1 | 9.6 | % | 11.5 | (3.2) | (21.8) | % | |||||||||||||||||||||||||||
| Total water production expenses | $ | 276.7 | $ | 21.3 | 8.3 | % | $ | 255.4 | $ | 2.5 | 4.5 | % | |||||||||||||||||||||||
The principal factors affecting water production expenses are the quantity, price and source of the water. Generally, water pumped from wells costs less than water purchased from wholesale suppliers.
The table below provides the amounts, percentage change, and source mix for the respective years:
| 2020 | 2019 | ||||||||||||||||||||||||||||||||||
| MG | % of Total | % change from prior year | MG | % of Total | % change from prior year | ||||||||||||||||||||||||||||||
| Millions of gallons (MG) | |||||||||||||||||||||||||||||||||||
| Source: | |||||||||||||||||||||||||||||||||||
| Wells | 49,116 | 44.4 | % | 7.8 | % | 45,575 | 43.5 | % | (7.6) | % | |||||||||||||||||||||||||
| Purchased | 55,948 | 50.5 | % | 4.1 | % | 53,743 | 51.3 | % | 0.7 | % | |||||||||||||||||||||||||
| Surface | 5,678 | 5.1 | % | 4.8 | % | 5,417 | 5.2 | % | 10.8 | % | |||||||||||||||||||||||||
| Total | 110,742 | 100.0 | % | 5.7 | % | 104,735 | 100.0 | % | (2.7) | % | |||||||||||||||||||||||||
Purchased water expenses are affected by changes in quantities purchased, supplier prices, and cost differences between wholesale suppliers. The MCBA mechanism is designed to recover all incurred purchased water expenses.
For 2020, the $17.6 million increase in purchased water expenses is due to a 4.1% increase in purchased quantities and an overall blended water wholesaler rate increase of 4.0%.
Purchased power expenses are affected by the quantity of water pumped from wells and moved through the distribution system, rates charged by electric utility companies, and rate structures applied to usage during peak and non-peak times of the day or season. In 2020, purchased power expenses increased $2.6 million mainly due to a 5.7% increase in water production.
Changes in climate change regulations could increase the cost of power which in turn would result in an increase in the rates our power suppliers charge us. Any change in pricing of our purchased power expenses in California would be recovered from our customers through the MCBA mechanism. Any change in power costs in other states would be requested to be recovered by the customers in those states. The impact of such legislation is dependent upon the enacted date, the factors that impact our suppliers' cost structure, and their ability to pass the costs to us in their approved tariffs. These items are not known at this time.
39
Administrative and General Expenses
Administrative and general expenses include payroll related to administrative and general functions, all employee benefits charged to expense accounts, insurance expenses, legal fees, expenses associated with being a public company, and general corporate expenses.
During 2020, administrative and general expense increased $8.4 million or 7.8%, as compared to 2019. The increase was mainly due to employee pension and retiree medical expense increase of $7.2 million, employee wage increase of $2.9 million, outside service increase of $2.1 million, and uninsured loss increase of $1.7 million. The increases were partially offset by a $1.7 decrease in employee healthcare costs and $1.6 million travel costs. Employee pension benefit expenses are fully recovered in rates and are tracked in the pension cost balancing account, such that revenues are recovered on a dollar-for-dollar basis up to the amounts authorized in the 2018 GRC. Employee and retiree medical expenses are recovered in rates through health cost balancing account authorized in the 2018 GRC, such that revenues are recovered up to 85% of the variance between adopted and recorded expenses.
Other Operations Expenses
The components of other operations expenses include payroll, material and supplies, and contract service costs of operating the regulated water systems, including the costs associated with water transmission and distribution, pumping, water quality, meter reading, billing, operations of district offices, and water conservation programs.
During 2020, other operations expenses increased $5.8 million, or 6.4%, compared to 2019. The increase was mostly due to increases in bad debt reserve expense of $4.1 million, increase in cost associated with the deferral of operating revenue of $3.9 million, increase in customer accounts expenses of $1.6 million, and an increase in employee wage cost of $1.0 million, which was partially offset by $7.1 million of water conservation program expenses. Water conservation program expenses are fully recovered in rates and are tracked in the conservation balancing account if it is within the authorized amount, such that revenues are recovered on a dollar-for-dollar basis up to the amounts authorized in the 2018 GRC.
Maintenance
Maintenance expenses increased $1.2 million, or 4.4%, in 2020, compared to 2019 due to increased costs for repairs of transmission and distribution mains, and reservoirs and tanks.
Depreciation and Amortization
Depreciation and amortization increased $9.3 million in 2020, or 10.4%, primarily due to capital additions.
Income Taxes
For 2020 income taxes decreased $4.8 million, or 29.8%, to $11.4 million as compared to 2019. The decrease was primarily due to the tax benefit from the flow through method of repairs deductions for California state income tax partially offset by an increase in operating income. The Company’s effective combined income tax rate for 2020 was 11.04% as compared to 21.9% for 2019.
Property and Other Taxes
For 2020, property and other taxes increased $1.2 million, or 4.3%, as compared to 2019. The increase was due to an increase in our assessed property values for utility plant placed in service during the year.
Other Income and Expenses
In 2020, net other income decreased $2.9 million from net other income of $4.9 million in 2019. The decrease was due primarily to a $1.7 million decrease in the allowance for equity funds used during construction and a $0.8 million decrease in unrealized gains from certain benefit plan investments due to market conditions.
Net Interest Expense
In 2020, net interest expense increased $0.6 million as compared to 2019. The increase relates to an increase in average daily borrowings on the unsecured revolving credit facilities.
40
Rates and Regulation
The following is a summary of 2020 rate filings. A description of the "Type of Filing" can be found in the "Item 1 - Rates and Regulation" section above. California decisions and resolutions may be found on the CPUC website at www.cpuc.ca.gov.
| Type of Filing | Decision/Resolution | Effective Date | Increase (Decrease) Annual Revenue |
CA District/ Subsidiary |
||||||||||
| GRC and Offset Filings | ||||||||||||||
| Cal Water 2018 GRC | D2012007 | Jan 2020 | $9.6 million | All Districts | ||||||||||
| 2020 Expense Offset | AL 2373 | Feb 2020 | $2.5 million | 6 Districts | ||||||||||
| 2020 Rate Base Offset | AL 2373 | Feb 2020 | $2.5 million | All Districts | ||||||||||
| 2020 Rate Base Offset | AL 2387 | Aug 2020 | $9.0 million | 1 Districts | ||||||||||
The estimated impact of current and prior year rate changes on operating revenues compared to prior years is listed in the following table:
| 2020 | 2019 | ||||||||||
| Dollars in millions | |||||||||||
| General Rate Case (GRC) | $ | 9.9 | $ | 2.3 | |||||||
| Escalation rate increases | 0.5 | 16.2 | |||||||||
| Expense offset (purchased water/pump taxes) | 4.5 | 5.7 | |||||||||
| Rate base offsets | 6.0 | 1.2 | |||||||||
| Total rate increases | $ | 20.9 | $ | 25.4 | |||||||
Water Supply
Our source of supply varies among our operating districts. Certain districts obtain all of their supply from wells; some districts purchase all of their supply from wholesale suppliers; and other districts obtain supply from a combination of wells and wholesale suppliers. A small portion of supply comes from surface sources and is processed through Company-owned water treatment plants. To the best of management's knowledge, we are meeting water quality, environmental, and other regulatory standards for all Company-owned systems.
California's normal weather pattern yields little precipitation between mid-spring and mid-fall. The Washington Water service areas receive precipitation in all seasons, with the heaviest amounts during the winter. New Mexico Water's rainfall is heaviest in the summer monsoon season. Hawaii Water receives precipitation throughout the year, with the largest amounts in the winter months. Water usage in all service areas is highest during the warm and dry summers and declines in the cool winter months. Rain and snow during the winter months replenish underground water aquifers and fill reservoirs, providing the water supply for subsequent delivery to customers. Management believes that supply pumped from underground aquifers and purchased from wholesale suppliers will be adequate to meet customer demand during 2021 and beyond. However, water rationing may be required in future periods, if declared by the state or local jurisdictions. Long-term water supply plans are developed for each of our districts to help assure an adequate water supply under various operating and supply conditions. Some districts have unique challenges in meeting water quality standards, but management believes that supplies will meet current standards using current treatment processes.
41
Liquidity and Capital Resources
Cash flow from Operations
During 2020, we generated cash flow from operations of $117.9 million, compared to $168.8 million during 2019. The decrease in 2020 was primarily due to the recording of the IRMA receivable that resulted from the delay in the approval of the 2018 GRC and increased funding for pension and other post-retirement benefits during 2020.
The water business is seasonal. Billed revenue is lower in the cool, wet winter months when less water is used compared to the warm, dry summer months when water use is highest. This seasonality results in the possible need for short-term borrowings under the bank lines of credit in the event cash is not sufficient to cover operating and capital costs during the winter period. The increase in cash flow during the summer allows short-term borrowings to be paid down. Customer water usage can be lower than normal in years when more than normal precipitation falls in our service areas or temperatures are lower than normal, especially in the summer months. The reduction in water usage reduces cash flow from operations and increases the need for short-term bank borrowings. In addition, short-term borrowings are used to finance capital expenditures until long-term financing is arranged.
Investing Activities
During 2020 and 2019 we used $298.7 million and $273.8 million, respectively, of cash for capital expenditures, both Company-funded and developer-funded. The 2020 capital expenditures exceeded the high end of the budgeted capital expenditures of $290.0 million due to favorable weather patterns at the end of the year that allowed construction activities to continue uninterrupted. Cash used in investing activities fluctuates each year largely due to the availability of construction resources and our ability to obtain construction permits in a timely manner. We also paid $40.5 million for the acquisitions of Rainier View Water Company and Kalealoa Water Company in 2020.
Financing Activities
During 2020, we borrowed $335.0 million, and paid down $140.1 million on our unsecured revolving credit facilities to fund capital expenditures and for general corporate purposes. We also received $27.3 million of advances and contributions in aid of construction, which was reduced by refunds to developers of $10.2 million. We also repaid $22.1 million of First Mortgage Bonds that matured in 2020 and other long-term debt obligations. In addition, we issued $83.6 million of Company common stock through our at-the-market equity plan and our employee stock purchase plan.
On March 29, 2019, the Company and Cal Water entered into certain syndicated credit agreements, which provide for unsecured revolving credit facilities of up to an initial aggregate amount of $550.0 million for a term of five years. The revolving credit facilities amend, expand, and replace the Company’s and its subsidiaries’ prior credit facilities originally entered into on May 10, 2015. The new credit facilities extended the terms until March 29, 2024, and increased Cal Water’s unsecured revolving line of credit. The Company and subsidiaries that it designates may borrow up to $150.0 million under the Company’s revolving credit facility. Cal Water may borrow up to $400.0 million under its revolving credit facility. All borrowings must be repaid within 24 months unless a different period is required or authorized by the CPUC. Additionally, the credit facilities may be increased by up to an incremental $150.0 million under the Cal Water facility and $50.0 million under the Company facility, subject in each case to certain conditions. The proceeds from the revolving credit facilities may be used for working capital purposes, including the short-term financing of capital projects. Borrowings under the credit facilities typically have maturities varying between one and nine months and will bear interest annually at a rate equal to (i) the base rate or (ii) the Eurodollar rate, plus an applicable margin of 0.650% to 0.875%, depending on the Company and its subsidiaries’ consolidated total capitalization ratio.
The under-collected net WRAM and MCBA receivable balances were $67.8 million and $62.6 million as of December 31, 2020 and 2019, respectively. The increase of $5.2 million from December 31, 2019 to December 31, 2020 was primarily due to a mix shift in water production from well water to purchased water in certain of our service territories. The under-collected net WRAM and MCBA receivable balances were primarily financed by Cal Water with short-term and long-term financing arrangements to meet operational cash requirements. Interest on the under-collected net WRAM and MCBA receivable balances, the interest recoverable from customers, is limited to the current 90-day commercial paper rate, which is significantly lower than Cal Water's short and long-term financing rates.
Bond principal and other long-term debt payments were $22.1 million during 2020 and $405.6 million during 2019.
42
At the January 2021 meeting, the Board of Directors declared the quarterly dividend, increasing it for the 54th consecutive year. The quarterly dividend was raised from $0.2125 to $0.2300 per common share. This represents an indicated annual rate of $0.9200 per common share. Dividends have been paid for 75 consecutive years. The annual dividends paid per common share in 2020, 2019, and 2018 were $0.8500, $0.7900, and $0.7500, respectively. Earnings not paid as dividends are reinvested in the business for the benefit of stockholders. The dividend payout ratio was 43.1% in 2020, 60.3% in 2019, and 55.2% in 2018 for an average of 52.9% over the 3-year period. Our long-term targeted dividend payout ratio is 60%.
Short-Term Financing
Short-term liquidity is provided by the bank lines of credit described above and by internally generated funds. As of December 31, 2020, there were borrowings of $370.0 million outstanding on our unsecured revolving lines of credit, compared to $175.1 million outstanding on our unsecured revolving lines of credit as of December 31, 2019.
Given our ability to access our lines of credit on a daily basis, cash balances are managed to levels required for daily cash needs and excess cash is invested in short-term or cash equivalent instruments. Minimal operating levels of cash are maintained for Washington Water, New Mexico Water, and Hawaii Water.
The Company and subsidiaries which it designates may borrow up to $150.0 million under its credit facility. Cal Water may borrow up to $400.0 million under its credit facility; however, all borrowings currently need to be repaid within 24 months unless otherwise authorized by the CPUC.
Both credit agreements contain affirmative and negative covenants and events of default customary for credit facilities of this type including, among other things, limitations and prohibitions relating to additional indebtedness, liens, mergers, and asset sales. Also, these unsecured credit agreements contain financial covenants governing the Company and its subsidiaries' "consolidated total capitalization ratio" not to exceed 66.7% and "interest coverage ratio" of three or more (each as defined in the respective credit agreements). As of December 31, 2020, our consolidated total capitalization ratio was 58.4% and the interest coverage ratio was greater than five. In summary, as of such date, we met all of the covenant requirements and were eligible to use the full amounts of these credit agreements.
Long-Term Financing
Long-term financing is accomplished through the use of both debt and equity. Cal Water was authorized to issue $700.0 million of debt and common stock to finance capital projects and operations by a CPUC decision dated November 5, 2020. In addition, the decision retained approximately $94.0 million of prior financing authority and determined that refinancing long-term debt did not count against the authorization. The CPUC requires that any loans from Cal Water to the Company be at arm’s length. This restriction did not materially impact the Company's ability to meet its cash obligations in 2020. Management does not expect this restriction to have a material impact on the Company's ability to meet its cash obligations in 2021 and beyond.
On June 11, 2019, Cal Water issued $400.0 million of First Mortgage Bonds (see Note 9) in a private placement. Cal Water used the net proceeds from the sale of the bonds to pay down outstanding short-term borrowings and to redeem $300.0 million of First Mortgage Bond series UUU. Long-term financing, which includes First Mortgage Bonds, senior notes, other debt securities, and common stock, has typically been used to replace short-term borrowings and fund capital expenditures. Internally generated funds, after making dividend payments, provide positive cash flow, but have not been at a level to meet the needs of our capital expenditure requirements. Management expects this trend to continue given our capital expenditures plan for the next five years. Some capital expenditures are funded by payments received from developers for contributions in aid of construction or advances for construction. Funds received for contributions in aid of construction are non-refundable, whereas funds classified as advances in construction are refundable. Management believes long-term financing is available to meet our cash flow needs through issuances in both debt and equity instruments.
Additional information regarding the bank borrowings and long-term debt is presented in Notes 8 and 9 in the Notes to Consolidated Financial Statements.
43
Equity Issuance
On October 31, 2019, the Company entered into an equity distribution agreement to sell shares of its common stock having an aggregate gross sales price of up to $300.0 million from time to time depending on market conditions through an at-the-market equity program over the next three years. The Company intends to use the net proceeds from these sales, after deducting commissions on such sales and offering expenses, for general corporate purposes, which may include working capital, construction and acquisition expenditures, investments and repurchases and redemptions of securities. Additional information regarding this program is presented in Note 7 of the Notes to Consolidated Financial Statements.
Summarized Financial Information for Guarantors and the Issuer of Guaranteed Securities.
On April 17, 2009, Cal Water (Issuer) issued $100.0 million aggregate principal amount of 5.500% First Mortgage Bonds due 2040, all of which are fully and unconditionally guaranteed by the Company (Guarantor). Certain subsidiaries of the Company do not guarantee the security and are referred to as Non-guarantors. The Guarantor fully, absolutely, irrevocably and unconditionally guarantees the due and punctual payment when due, whether at stated maturity, by acceleration, by notice of prepayment or otherwise, of the principal of, premium, if any, and interest on the bonds. The bonds rank equally among Cal Water's other first mortgage bonds.
The following tables present summarized financial information of the Issuer subsidiaries and the Guarantor. All intercompany balances and transactions between subsidiaries under Issuer and Guarantor have been eliminated. The information presented below excludes eliminations necessary to arrive at the information on a consolidated basis. In presenting the summarized financial statements, the equity method of accounting has been applied to the Issuer interests in the Guarantor. The summarized information excludes financial information of the Non-guarantors, including earnings from and investments in these entities.
| Summarized Statement of Operations | |||||||||||||||||||||||
| (in thousands) | 2020 | 2019 | |||||||||||||||||||||
| Issuer | Guarantor | Issuer | Guarantor | ||||||||||||||||||||
| Net sales | $ | 745,034 | $ | — | $ | 669,769 | $ | — | |||||||||||||||
| Gross profit | $ | 477,915 | $ | — | $ | 423,915 | $ | — | |||||||||||||||
| Income from operations | $ | 130,761 | $ | 331 | $ | 92,911 | $ | 411 | |||||||||||||||
| Equity in earnings of guarantor | $ | 92,244 | $ | 58,447 | |||||||||||||||||||
| Net income | $ | 92,244 | $ | 92,760 | $ | 58,447 | $ | 58,818 | |||||||||||||||
| Summarized Balance Sheet Information | |||||||||||||||||||||||
| (in thousands) | As of December 31, 2020 | As of December 31, 2019 | |||||||||||||||||||||
| Issuer | Guarantor | Issuer | Guarantor | ||||||||||||||||||||
| Current assets | $ | 227,030 | $ | 20,075 | $ | 164,712 | $ | 3,186 | |||||||||||||||
| Intercompany receivable from non-guarantor | $ | 4,905 | $ | 20,022 | $ | 3,621 | $ | 25,803 | |||||||||||||||
| Other assets | $ | 433,837 | $ | 943,665 | $ | 510,230 | $ | 777,969 | |||||||||||||||
| Long-term intercompany receivable from non-guarantor | $ | — | $ | 37,985 | $ | — | $ | 30,060 | |||||||||||||||
| Net utility plant | $ | 2,459,992 | $ | 117 | $ | 2,252,704 | $ | 211 | |||||||||||||||
| Total assets | $ | 3,125,764 | $ | 1,021,864 | $ | 2,931,267 | $ | 837,229 | |||||||||||||||
| Current liabilities | $ | 481,247 | $ | 100,124 | $ | 296,720 | $ | 55,413 | |||||||||||||||
| Intercompany payable to guarantor and non-guarantor | $ | 402 | $ | 6,115 | |||||||||||||||||||
| Long-term debt | $ | 780,790 | $ | — | $ | 786,310 | $ | — | |||||||||||||||
| Other liabilities | $ | 1,034,098 | $ | 1,725 | $ | 1,141,338 | $ | 1,520 | |||||||||||||||
| Total Liabilities | $ | 2,296,537 | $ | 101,849 | $ | 2,230,483 | $ | 56,933 | |||||||||||||||
Off-Balance Sheet Transactions
We do not utilize off-balance-sheet financing or utilize special purpose entity arrangements for financing. We do not have equity ownership through joint ventures or partnership arrangements.
44
Contractual Obligations
The contractual obligations presented in the table below represent our estimates of future payments under fixed contractual obligations and commitments. Changes in our business needs, cancellation provisions and changes in interest rates, as well as action by third parties and other factors, may cause these estimates to change. Therefore, our actual payments in future periods may vary from those presented in the table below.
The following table summarizes our contractual obligations as of December 31, 2020.
| Total | Less than1 Year | 1-3 Years | 3-5 Years | After 5 Years | ||||||||||||||||||||||||||||
| Long-term debt (a) | $ | 785,512 | $ | 4,914 | $ | 6,199 | $ | 70,730 | $ | 703,669 | ||||||||||||||||||||||
| Interest payments | 755,341 | 36,411 | 72,016 | 71,714 | 575,200 | |||||||||||||||||||||||||||
| Advances for construction | 195,625 | 8,576 | 17,152 | 17,152 | 152,745 | |||||||||||||||||||||||||||
| Pension and postretirement benefits (b) | 300,486 | 20,331 | 46,771 | 55,634 | 177,750 | |||||||||||||||||||||||||||
| Finance lease obligations (c) | 6,065 | 987 | 2,493 | 1,880 | 705 | |||||||||||||||||||||||||||
| Operating lease obligations | 20,230 | 2,302 | 3,779 | 3,202 | 10,947 | |||||||||||||||||||||||||||
| Water supply contracts (d) | 775,676 | 37,911 | 75,825 | 75,821 | 586,119 | |||||||||||||||||||||||||||
| Total contractual obligations | $ | 2,838,935 | $ | 111,432 | $ | 224,235 | $ | 296,133 | $ | 2,207,135 | ||||||||||||||||||||||
_______________________________________________________________________________
a.Excludes finance lease obligations as reported below. Also, excludes unamortized debt issuance costs of $4.5 million.
b.Pension and postretirement benefits include $2.1 million of short-term pension obligations.
c.Finance lease obligations represent total cash payments to be made in the future and include interest expense of $0.9 million.
d.Estimated annual contractual obligations are based on the same payment levels as 2020.
For pension and postretirement benefits other than pensions obligations, see Note 12 of the Notes to the Consolidated Financial Statements.
Long-term debt payments include annual sinking fund payments on First Mortgage Bonds, maturities of long-term debt, and annual payments on other long-term obligations.
Advances for construction represent annual contract refunds to developers for the cost of water systems paid for by the developers. The contracts are non-interest bearing, and refunds are generally on a straight-line basis over a 40-year period. System and facility leases include obligations associated with leasing water systems and rents for office space.
For finance and operating lease obligations, see Note 15 of the Notes to the Consolidated Financial Statements.
Cal Water has water supply contracts with wholesale suppliers in 13 of its operating districts and for the two leased systems in Hawthorne and Commerce. For each contract, the cost of water is established by the wholesale supplier and is generally beyond our control. The amount paid annually to the wholesale suppliers is charged to purchased water expense on our statement of income. Most contracts do not require minimum annual payments and vary with the volume of water purchased. For more details related to water supply contracts, see Note 15 of the Notes to the Consolidated Financial Statements.
Capital Requirements
Capital requirements consist primarily of new construction expenditures for expanding and replacing utility plant facilities and the acquisition of water systems. They also include refunds of advances for construction.
Company-funded and developer-funded utility plant expenditures were $298.7 million and $273.8 million in 2020 and 2019, respectively. A majority of capital expenditures was associated with mains and water treatment equipment.
For 2021, the Company is estimating its capital expenditures to be between $270.0 million and $300.0 million based on the 2018 GRC in California and normal capital needs in the other subsidiaries. We expect our annual capital expenditure to increase during the next five years due to increasing needs to replace and maintain infrastructure.
45
Management expects developer-funded expenditures in 2021. These expenditures will be financed by developers through refundable advances for construction and non-refundable contributions in aid of construction. Developers are required to deposit the cost of a water construction project with us prior to our commencing construction work, or the developers may construct the facilities themselves and deed the completed facilities to us. Funds are generally received in advance of incurring costs for these projects. Advances are normally refunded over a 40-year period without interest. Future payments for advances received are listed under contractual obligations above. Because non-Company-funded construction activity is solely at the discretion of developers, we cannot predict the level of future activity. The cash flow impact is expected to be minor due to the structure of the arrangements.
Capital Structure
Common stockholders' equity was $921.3 million at December 31, 2020, compared to $779.9 million at December 31, 2019. The Company sold 1,710,779 and 381,105 shares of its common stock in 2020 and 2019 respectively through its at-the-market equity program.
Total capitalization, including the current portion of long-term debt, was $1,707.6 million at December 31, 2020 and $1,588.5 million at December 31, 2019. In 2020, Cal Water repaid $22.1 million for First Mortgage Bonds that matured in 2020 and other long-term debt obligations. In 2019, Cal Water issued $400.0 million of First Mortgage Bonds in a private placement and repaid $405.6 million for First Mortgage Bonds that matured or were redeemed in 2019 and other long-term debt obligations. In future periods, the Company intends to issue common stock and long-term debt to finance our operations. The capitalization ratios will vary depending upon the method we choose to finance our operations.
At December 31, capitalization ratios were:
| 2020 | 2019 | ||||||||||
| Common equity | 54.0 | % | 49.1 | % | |||||||
| Long-term debt | 46.0 | % | 50.9 | % | |||||||
The return (from both regulated and non-regulated operations) on average common equity was 11.4% in 2020 compared to 8.36% in 2019. Cal Water does not include construction work in progress in its regulated rate base; instead, Cal Water was authorized to record AFUDC on construction work in progress, effective January 1, 2017. Construction work in progress for Cal Water was $156.6 million at December 31, 2020 and $231.1 million at December 31, 2019.
Acquisitions
Refer to "Note 16 - Acquisitions" for 2020 acquisition activity. In 2019 there were no significant acquisitions.
Real Estate Program
We own real estate. From time to time, certain parcels are deemed no longer used or useful for water utility operations. Most surplus properties have a low cost basis. We developed a program to realize the value of certain surplus properties through sale or lease of those properties. The program will be ongoing for a period of several years. There were no significant sales in 2020 and 2019. As sales are dependent on real estate market conditions, future sales, if any, may or may not be at prior year levels.
46
Item 7A. Quantitative and Qualitative Disclosures about Market Risk.
We do not participate in hedge arrangements, such as forward contracts, swap agreements, options, or other contractual agreements to mitigate the impact of market fluctuations on our assets, liabilities, production, or contractual commitments. We operate only in the United States and, therefore, are not subject to foreign currency exchange rate risks.
Interest Rate Risk
We are subject to interest rate risk, although this risk is lessened because we operate in a regulated industry. If interest rates were to increase, management believes customer rates would increase accordingly, subject to Commission approval in future GRC filings. The majority of our debt is long-term at a fixed rate. Interest rate risk does exist on short-term borrowings within our credit facilities, as these interest rates are variable. We also have interest rate risk on new financing, as higher interest cost may occur on new debt if interest rates increase.
Over the next 12 months, approximately $5.1 million of the $786.2 million of existing long-term debt instruments will mature or require sinking fund payments. Applying a hypothetical 10 percent increase in the rate of interest charged on those borrowings would not have a material effect on our earnings.
Item 8. Financial Statements and Supplementary Data.
REPORT OF INDEPENDENT REGISTERED PUBLIC ACCOUNTING FIRM
To the Shareholders and the Board of Directors of California Water Service Group
San Jose, California
Opinions on the Financial Statements and Internal Control over Financial Reporting
We have audited the accompanying consolidated balance sheets of California Water Service Group and subsidiaries (the "Company") as of December 31, 2020 and 2019, the related consolidated statements of income, common stockholders' equity, and cash flows, for each of the three years in the period ended December 31, 2020, and the related notes (collectively referred to as the "financial statements"). We also have audited the Company’s internal control over financial reporting as of December 31, 2020, based on criteria established in Internal Control — Integrated Framework (2013) issued by the Committee of Sponsoring Organizations of the Treadway Commission (COSO).
In our opinion, the financial statements referred to above present fairly, in all material respects, the financial position of the Company as of December 31, 2020 and 2019, and the results of its operations and its cash flows for each of the three years in the period ended December 31, 2020, in conformity with accounting principles generally accepted in the United States of America. Also, in our opinion, the Company maintained, in all material respects, effective internal control over financial reporting as of December 31, 2020, based on criteria established in Internal Control — Integrated Framework (2013) issued by COSO.
Basis for Opinions
The Company’s management is responsible for these financial statements, for maintaining effective internal control over financial reporting, and for its assessment of the effectiveness of internal control over financial reporting, included in the accompanying Management's Annual Report on Internal Control over Financial Reporting. Our responsibility is to express an opinion on these financial statements and an opinion on the Company’s internal control over financial reporting based on our audits. We are a public accounting firm registered with the Public Company Accounting Oversight Board (United States) (PCAOB) and are required to be independent with respect to the Company in accordance with the U.S. federal securities laws and the applicable rules and regulations of the Securities and Exchange Commission and the PCAOB.
We conducted our audits in accordance with the standards of the PCAOB. Those standards require that we plan and perform the audits to obtain reasonable assurance about whether the financial statements are free of material misstatement, whether due to error or fraud, and whether effective internal control over financial reporting was maintained in all material respects.
47
Our audits of the financial statements included performing procedures to assess the risks of material misstatement of the financial statements, whether due to error or fraud and performing procedures to respond to those risks. Such procedures included examining, on a test basis, evidence regarding the amounts and disclosures in the financial statements. Our audits also included evaluating the accounting principles used and significant estimates made by management, as well as evaluating the overall presentation of the financial statements. Our audit of internal control over financial reporting included obtaining an understanding of internal control over financial reporting, assessing the risk that a material weakness exists, and testing and evaluating the design and operating effectiveness of internal control based on the assessed risk. Our audits also included performing such other procedures as we considered necessary in the circumstances. We believe that our audits provide a reasonable basis for our opinions.
Definition and Limitations of Internal Control over Financial Reporting
A company’s internal control over financial reporting is a process designed to provide reasonable assurance regarding the reliability of financial reporting and the preparation of financial statements for external purposes in accordance with generally accepted accounting principles. A company’s internal control over financial reporting includes those policies and procedures that (1) pertain to the maintenance of records that, in reasonable detail, accurately and fairly reflect the transactions and dispositions of the assets of the company; (2) provide reasonable assurance that transactions are recorded as necessary to permit preparation of financial statements in accordance with generally accepted accounting principles, and that receipts and expenditures of the company are being made only in accordance with authorizations of management and directors of the company; and (3) provide reasonable assurance regarding prevention or timely detection of unauthorized acquisition, use, or disposition of the company’s assets that could have a material effect on the financial statements.
Because of its inherent limitations, internal control over financial reporting may not prevent or detect misstatements. Also, projections of any evaluation of effectiveness to future periods are subject to the risk that controls may become inadequate because of changes in conditions, or that the degree of compliance with the policies or procedures may deteriorate.
Critical Audit Matter
The critical audit matter communicated below is a matter arising from the current-period audit of the financial statements that was communicated or required to be communicated to the audit committee and that (1) relates to accounts or disclosures that are material to the financial statements and (2) involved our especially challenging, subjective, or complex judgments. The communication of critical audit matters does not alter in any way our opinion on the financial statements, taken as a whole, and we are not, by communicating the critical audit matter below, providing a separate opinion on the critical audit matter or on the accounts or disclosures to which it relates.
Impact of Rate Regulation on the Financial Statements - Refer to Note 2 to the financial statements
Critical Audit Matter Description
The Company is subject to rate regulation by the California Public Utilities Commission (“the Commission”), which has jurisdiction with respect to the rates of water and wastewater service companies in California. Management has determined it meets the requirements under accounting principles generally accepted in the United States of America to prepare its financial statements applying the specialized rules to account for the effects of cost-based rate regulation. Accounting for the economics of rate regulation impacts multiple financial statement line items and disclosures, such as utility plant; regulatory assets and liabilities; operating revenue; operating expenses; and depreciation expense.
The Commission establishes rates that are designed to permit the recovery of the cost of service and a return on investment. The Company’s rates are subject to regulatory rate-setting processes including a General Rate Case proceeding. The Company capitalizes and records regulatory assets for costs that would otherwise be charged to expense if it is probable that the incurred costs will be recovered in future rates. If costs expected to be incurred in the future are currently being recovered through rates, the Company records those expected future costs as regulatory liabilities. Determining probability requires significant judgment by management and includes, but is not limited to, consideration of testimony presented in regulatory hearings, proposed regulatory decisions, final regulatory orders, and the strength or status of applications for rehearing or state court appeals. If the Company determines that a portion of the assets used in utility operations are not recoverable in customer rates, the Company would be required to recognize the loss of the assets disallowed.
48
We identified the impact of rate regulation as a critical audit matter due to the significant judgments that underlie the Company’s regulatory account balances and disclosures and the high degree of subjectivity involved in assessing the impact of regulatory decisions on the financial statements. Management judgments include interpreting the intent of the Commission’s decisions when appropriately measuring related regulatory assets or liabilities and assessing the probability of (1) recovery in future rates of incurred costs and (2) the requirement to refund to customers amounts collected prior to costs being incurred. Given that management’s accounting judgements are based on assumptions about the outcome of future regulatory decisions and interpretation of new or revised regulatory decisions, auditing these judgments required specialized knowledge of accounting for rate regulation and the rate setting process due its inherent complexities and pervasive impact on the financial statements.
How the Critical Audit Matter Was Addressed in the Audit
Our audit procedures related to the interpretation of new or revised regulatory decisions, and the uncertainty of future regulatory hearings, proposed regulatory decisions, final regulatory orders, and the strength or status of applications for rehearing or state court appeals included the following, among others:
•We tested the effectiveness of management’s controls over the determination of regulatory assets or liabilities and the evaluation of the likelihood of (1) the recovery in future rates of costs incurred as property, plant, and equipment and deferred as regulatory assets, and (2) a refund or a future reduction in rates that should be reported as regulatory liabilities. We also tested the effectiveness of management’s controls over the initial recognition of amounts as utility plant; regulatory assets or liabilities; and the monitoring and evaluation of regulatory developments that may affect the likelihood of recovering costs in future rates or of a future reduction in rates.
•We read regulatory orders issued by the Commission for the Company, regulatory statutes, interpretations, procedural memorandums, filings made by interveners, and other publicly available information to evaluate management’s interpretation of the accounting impacts of any new or revised regulatory decisions and their impact on measuring related regulatory assets and liabilities. We evaluated the external information and compared it to management’s recorded regulatory asset and liability balances for completeness.
•We obtained supporting documentation (such as letters or memorandums) from management, as appropriate, regarding probability of recovery for regulatory assets or refund or future reduction in rates for regulatory liabilities not yet addressed in a regulatory order to assess management’s assertion that amounts are probable of recovery or a future reduction in rates.
•We obtained supporting documentation from management regarding their interpretation of the intent of Commission decisions and evaluated management’s assumptions and methodologies used in measuring regulatory assets and liabilities for compliance with the related orders. We reconciled the underlying data or inputs used in the measurement to rate decisions approved by the Commission and tested the mathematical accuracy of the calculations.
•We evaluated the Company’s disclosures related to the impacts of rate regulation, including the balances recorded and regulatory developments.
/s/ DELOITTE & TOUCHE LLP
San Francisco, California
February 25, 2021
We have served as the Company's auditor since 2008.
49
CALIFORNIA WATER SERVICE GROUP
Consolidated Balance Sheets
| December 31, | |||||||||||
| 2020 | 2019 | ||||||||||
| (In thousands, except per share data) | |||||||||||
| ASSETS | |||||||||||
| Utility plant: | |||||||||||
| Land | $ | $ | |||||||||
| Depreciable plant and equipment | |||||||||||
| Construction work in progress | |||||||||||
| Intangible assets | |||||||||||
| Total utility plant | |||||||||||
| Less accumulated depreciation and amortization | ( |
( |
|||||||||
| Net utility plant | |||||||||||
| Current assets: | |||||||||||
| Cash and cash equivalents | |||||||||||
| Receivables: | |||||||||||
| Customers, net | |||||||||||
| Regulatory balancing accounts | |||||||||||
| Other, net | |||||||||||
| Unbilled revenue, net | |||||||||||
| Materials and supplies at weighted average cost | |||||||||||
| Taxes, prepaid expenses, and other assets | |||||||||||
| Total current assets | |||||||||||
| Other assets: | |||||||||||
| Regulatory assets | |||||||||||
| Goodwill | |||||||||||
| Other | |||||||||||
| Total other assets | |||||||||||
| TOTAL ASSETS | $ | $ | |||||||||
| CAPITALIZATION AND LIABILITIES | |||||||||||
| Capitalization: | |||||||||||
Common stock, $ |
$ | $ | |||||||||
| Additional paid-in capital | |||||||||||
| Retained earnings | |||||||||||
| Total common stockholders' equity | |||||||||||
| Long-term debt, net | |||||||||||
| Total capitalization | |||||||||||
| Current liabilities: | |||||||||||
| Current maturities of long-term debt, net | |||||||||||
| Short-term borrowings | |||||||||||
| Accounts payable | |||||||||||
| Regulatory balancing accounts | |||||||||||
| Accrued other taxes | |||||||||||
| Accrued interest | |||||||||||
| Other accrued liabilities | |||||||||||
| Total current liabilities | |||||||||||
| Deferred income taxes | |||||||||||
| Regulatory liabilities | |||||||||||
| Pension and postretirement benefits other than pensions | |||||||||||
| Advances for construction | |||||||||||
| Contributions in aid of construction | |||||||||||
| Other long-term liabilities | |||||||||||
| Commitments and contingencies | |||||||||||
| TOTAL CAPITALIZATION AND LIABILITIES | $ | $ | |||||||||
See accompanying Notes to Consolidated Financial Statements.
50
CALIFORNIA WATER SERVICE GROUP
Consolidated Statements of Income
| For the Years Ended December 31, | |||||||||||||||||
| 2020 | 2019 | 2018 | |||||||||||||||
| (In thousands, except per share data) | |||||||||||||||||
| Operating revenue | $ | $ | $ | ||||||||||||||
| Operating expenses: | |||||||||||||||||
| Operations: | |||||||||||||||||
| Purchased water | |||||||||||||||||
| Purchased power | |||||||||||||||||
| Pump taxes | |||||||||||||||||
| Administrative and general | |||||||||||||||||
| Other operations | |||||||||||||||||
| Maintenance | |||||||||||||||||
| Depreciation and amortization | |||||||||||||||||
| Income taxes | |||||||||||||||||
| Property and other taxes | |||||||||||||||||
| Total operating expenses | |||||||||||||||||
| Net operating income | |||||||||||||||||
| Other income and expenses: | |||||||||||||||||
| Non-regulated revenue | |||||||||||||||||
| Non-regulated expenses | ( |
( |
( |
||||||||||||||
| Other components of net periodic benefit cost | ( |
( |
( |
||||||||||||||
| Allowance for equity funds used during construction | |||||||||||||||||
| Gain on sale of non-utility property | |||||||||||||||||
| Income tax (expense) benefit on other income and expenses | ( |
( |
|||||||||||||||
| Net other income (loss) | ( |
||||||||||||||||
| Interest expense: | |||||||||||||||||
| Interest expense | |||||||||||||||||
| Allowance for borrowed funds used during construction | ( |
( |
( |
||||||||||||||
| Net interest expense | |||||||||||||||||
| Net income | $ | $ | $ | ||||||||||||||
| Earnings per share: | |||||||||||||||||
| Basic | $ | $ | $ | ||||||||||||||
| Diluted | $ | $ | $ | ||||||||||||||
| Weighted average number of common shares outstanding: | |||||||||||||||||
| Basic | |||||||||||||||||
| Diluted | |||||||||||||||||
See accompanying Notes to Consolidated Financial Statements.
51
CALIFORNIA WATER SERVICE GROUP
Consolidated Statements of Common Stockholders' Equity
For the Years Ended December 31, 2020, 2019 and 2018
| Common Stock | Additional Paid-in Capital |
Retained Earnings |
Total Stockholders' Equity |
||||||||||||||||||||||||||
| Shares | Amount | ||||||||||||||||||||||||||||
| (In thousands) | |||||||||||||||||||||||||||||
| Balance at December 31, 2017 | $ | $ | $ | $ | |||||||||||||||||||||||||
| Net income | |||||||||||||||||||||||||||||
| Issuance of common stock | |||||||||||||||||||||||||||||
| Repurchase of common stock | ( |
( |
( |
||||||||||||||||||||||||||
Dividends paid on common stock ($ |
( |
( |
|||||||||||||||||||||||||||
| Balance at December 31, 2018 | |||||||||||||||||||||||||||||
| Net income | |||||||||||||||||||||||||||||
| Issuance of common stock | |||||||||||||||||||||||||||||
| Repurchase of common stock | ( |
( |
( |
( |
|||||||||||||||||||||||||
Dividends paid on common stock ($ |
( |
( |
|||||||||||||||||||||||||||
| Balance at December 31, 2019 | |||||||||||||||||||||||||||||
| Net income | |||||||||||||||||||||||||||||
| Issuance of common stock | |||||||||||||||||||||||||||||
| Repurchase of common stock | ( |
( |
( |
||||||||||||||||||||||||||
Dividends paid on common stock ($ |
( |
( |
|||||||||||||||||||||||||||
| Balance at December 31, 2020 | $ | $ | $ | $ | |||||||||||||||||||||||||
See accompanying Notes to Consolidated Financial Statements.
52
CALIFORNIA WATER SERVICE GROUP
Consolidated Statements of Cash Flows
| For the Years Ended December 31, | |||||||||||||||||
| 2020 | 2019 | 2018 | |||||||||||||||
| (In thousands) | |||||||||||||||||
| Operating activities: | |||||||||||||||||
| Net income | $ | $ | $ | ||||||||||||||
| Adjustments to reconcile net income to net cash provided by operating activities: | |||||||||||||||||
| Depreciation and amortization | |||||||||||||||||
| Amortization of debt premium and expenses | |||||||||||||||||
| Changes in normalized deferred income taxes | |||||||||||||||||
| Change in value of life insurance contracts | ( |
( |
|||||||||||||||
| Allowance for equity funds used during construction | ( |
( |
( |
||||||||||||||
| Stock-based compensation | |||||||||||||||||
| Gain on sale of non-utility properties | ( |
( |
|||||||||||||||
| Write-off of capital costs | |||||||||||||||||
| Changes in operating assets and liabilities: | |||||||||||||||||
| Receivables | ( |
( |
|||||||||||||||
| Unbilled revenue | ( |
( |
|||||||||||||||
| Taxes, prepaid expenses, and other assets | ( |
( |
( |
||||||||||||||
| Accounts payable | |||||||||||||||||
| Other current liabilities | ( |
( |
|||||||||||||||
| Other changes in noncurrent assets and liabilities | ( |
( |
|||||||||||||||
| Net cash provided by operating activities | |||||||||||||||||
| Investing activities: | |||||||||||||||||
| Utility plant expenditures | ( |
( |
( |
||||||||||||||
| Proceeds from sale of non-utility assets | |||||||||||||||||
| Business Acquisition, net of cash acquired | ( |
||||||||||||||||
| Payment for investments | ( |
||||||||||||||||
| Life insurance benefits | |||||||||||||||||
| Purchase of life insurance | ( |
( |
( |
||||||||||||||
| Net cash used in investing activities | ( |
( |
( |
||||||||||||||
| Financing activities: | |||||||||||||||||
| Short-term borrowings | |||||||||||||||||
| Repayment of short-term borrowings | ( |
( |
( |
||||||||||||||
Issuance of long-term debt, net of debt issuance costs of $ |
|||||||||||||||||
| Advances and contributions in aid of construction | |||||||||||||||||
| Refunds of advances for construction | ( |
( |
( |
||||||||||||||
| Retirement of long-term debt | ( |
( |
( |
||||||||||||||
| Repurchase of common stock | ( |
( |
( |
||||||||||||||
| Issuance of common stock | |||||||||||||||||
| Dividends paid | ( |
( |
( |
||||||||||||||
| Net cash provided by financing activities | |||||||||||||||||
| Change in cash, cash equivalents, and restricted cash | ( |
( |
|||||||||||||||
| Cash, cash equivalents, and restricted cash at beginning of year | |||||||||||||||||
| Cash, cash equivalents, and restricted cash at end of year | $ | $ | $ | ||||||||||||||
| Supplemental disclosures of cash flow information: | |||||||||||||||||
| Cash paid during the year for: | |||||||||||||||||
| Interest (net of amounts capitalized) | $ | $ | $ | ||||||||||||||
| Income taxes | |||||||||||||||||
| Supplemental disclosure of investing and financing non-cash activities: | |||||||||||||||||
| Accrued payables for investments in utility plant | |||||||||||||||||
| Utility plant contributed by developers | |||||||||||||||||
| Litigation proceeds for TCP and MTBE contamination reclassified from liability to depreciable plant and equipment | |||||||||||||||||
See accompanying Notes to Consolidated Financial Statements.
53
CALIFORNIA WATER SERVICE GROUP
Notes to Consolidated Financial Statements
December 31, 2020, 2019, and 2018
Dollar amounts in thousands unless otherwise stated
1 ORGANIZATION AND OPERATIONS
California Water Service Group (Company) is a holding company that provides water utility and other related services in California, Washington, New Mexico, and Hawaii through its wholly-owned subsidiaries. California Water Service Company (Cal Water), Washington Water Service Company (Washington Water), New Mexico Water Service Company (New Mexico Water), and Hawaii Water Service Company, Inc. (Hawaii Water) provide regulated utility services under the rules and regulations of their respective state's regulatory commissions (jointly referred to as the Commissions). CWS Utility Services and HWS Utility Services LLC provide non-regulated water utility and utility-related services.
The Company operates in one reportable segment, providing water and related utility services.
Basis of Presentation
The consolidated financial statements have been prepared in accordance with accounting principles generally accepted in the United States of America (GAAP) and include the Company's accounts and those of its wholly owned subsidiaries. All intercompany transactions and balances have been eliminated from the consolidated financial statements. In the opinion of management, the consolidated financial statements reflect all adjustments that are necessary to provide a fair presentation of the results for the periods covered.
The preparation of the Company's consolidated financial statements in accordance with GAAP requires management to make estimates and assumptions that affect the reported amounts of assets and liabilities and disclosure of contingent assets and liabilities at the consolidated balance sheet dates and the reported amounts of revenues and expenses for the periods presented. These include, but are not limited to, estimates and assumptions used in determining the Company's regulatory asset and liability balances based upon probability assessments of regulatory recovery, utility plant useful lives, revenues earned but not yet billed, asset retirement obligations, allowance for doubtful accounts, pension and other employee benefit plan liabilities, and income tax-related assets and liabilities. Actual results could differ from these estimates.
54
CALIFORNIA WATER SERVICE GROUP
Notes to Consolidated Financial Statements (Continued)
December 31, 2020, 2019, and 2018
Dollar amounts in thousands unless otherwise stated
2 SUMMARY OF SIGNIFICANT ACCOUNTING POLICIES
Operating Revenue
The following table disaggregates the Company’s operating revenue by source for the years ended December 31, 2020, 2019, and 2018:
| 2020 | 2019 | 2018 | |||||||||||||||
| Revenue from contracts with customers | $ | $ | $ | ||||||||||||||
| Regulatory balancing account revenue | |||||||||||||||||
| Total operating revenue | $ | $ | $ | ||||||||||||||
Revenue from contracts with customers
The Company principally generates operating revenue from contracts with customers by providing regulated water and wastewater services at tariff-rates authorized by the Commissions in the states in which they operate and non-regulated water and wastewater services at rates authorized by contracts with government agencies. Revenue from contracts with customers reflects amounts billed for the volume of consumption at authorized per unit rates, for a service charge, and for other authorized charges.
The Company satisfies its performance obligation to provide water and wastewater services over time as services are rendered. The Company applies the invoice practical expedient and recognizes revenue from contracts with customers in the amount for which the Company has a right to invoice. The Company has a right to invoice for the volume of consumption, for the service charge, and for other authorized charges.
The measurement of sales to customers is generally based on the reading of their meters, which occurs on a systematic basis throughout the month. At the end of each month, the Company estimates consumption since the date of the last meter reading and a corresponding unbilled revenue is recognized. The estimate is based upon the number of unbilled days that month and the average daily customer billing rate from the previous month (which fluctuates based upon customer usage).
Contract terms are generally short-term and at will by customers and, as a result, no separate financing component is recognized for the Company's collections from customers, which generally require payment within 30 days of billing. The Company applies judgment, based principally on historical payment experience, in estimating its customers’ ability to pay.
Certain customers are not billed for volumetric consumption, but are instead billed a flat rate at the beginning of each monthly service period. The amount billed is initially deferred and subsequently recognized over the monthly service period, as the performance obligation is satisfied. The deferred revenue balance or contract liability, which is included in "other accrued liabilities" on the consolidated balance sheets, is inconsequential.
In the following table, revenue from contracts with customers is disaggregated by class of customers for the years ended December 31, 2020, 2019, and 2018:
| 2020 | 2019 | 2018 | |||||||||||||||
| Residential | $ | $ | $ | ||||||||||||||
| Business | |||||||||||||||||
| Industrial | |||||||||||||||||
| Public authorities | |||||||||||||||||
| Other* | |||||||||||||||||
| Total revenue from contracts with customers | $ | $ | $ | ||||||||||||||
_______________________________________________________________________________
* Other includes accrued unbilled revenue
55
CALIFORNIA WATER SERVICE GROUP
Notes to Consolidated Financial Statements (Continued)
December 31, 2020, 2019, and 2018
Dollar amounts in thousands unless otherwise stated
2 SUMMARY OF SIGNIFICANT ACCOUNTING POLICIES (Continued)
Regulatory balancing account revenue
The Company’s ability to recover revenue requirements authorized by the California Public Utilities Commission (CPUC) in its triennial general rate case (GRC) is decoupled from the volume of the sales. Regulatory balancing account revenue is revenue related to rate mechanisms authorized in California by the CPUC, which allow the Company to recover the authorized revenue and are not considered contracts with customers. These mechanisms include the following:
The Water Revenue Adjustment Mechanism (WRAM) allows the Company to recognize the adopted level of volumetric revenues. The variance between adopted volumetric revenues and actual billed volumetric revenues for metered accounts is recorded as regulatory balancing account revenue.
Cost-recovery rates, such as the Modified Cost Balancing Account (MCBA), Conservation Expense Balancing Account (CEBA), Pension Cost Balancing Account (PCBA), and Health Cost Balancing Account (HCBA), generally provide for recovery of the adopted levels of expenses for purchased water, purchased power, pump taxes, water conservation program costs, pension, and health care. Variances between adopted and actual costs are recorded as regulatory balancing account revenue.
As a result of the delay in the approval of the 2018 GRC, the CPUC authorized Cal Water to track the effect of the delay on customer billings in an Interim Rates Memorandum Account (IRMA) effective January 1, 2020. Variances between actual customer billings and those that would have been billed assuming the GRC had been effective January 1, 2020 are recorded as regulatory balancing account revenue. The 2018 GRC was approved in December of 2020 and final rates for the 2018 GRC were not implemented in 2020; as a result, Cal Water calculated and recorded this difference for all of 2020. Cal Water determined that the IRMA met regulatory asset recognition criteria under accounting standards for regulated utilities.
Each district's WRAM and MCBA regulatory assets and liabilities are allowed to be netted against one another. The Company recognizes regulatory balancing account revenues that have been authorized for rate recovery, are objectively determinable and probable of recovery, and are expected to be collected within 24 months. To the extent that regulatory balancing account revenue is estimated to be collectible beyond 24 months, recognition is deferred.
Non-Regulated Revenue
The following tables disaggregate the Company’s non-regulated revenue by source for the years ended December 31, 2020, 2019, and 2018:
| 2020 | 2019 | 2018 | |||||||||||||||
| Operating and maintenance revenue | $ | $ | $ | ||||||||||||||
| Other non-regulated revenue | |||||||||||||||||
| Non-regulated revenue from contracts with customers | $ | $ | $ | ||||||||||||||
| Lease revenue | |||||||||||||||||
| Total non-regulated revenue | $ | $ | $ | ||||||||||||||
Operating and maintenance services are provided for non-regulated water and wastewater systems owned by private companies and municipalities. The Company negotiates formal agreements with the customers, under which they provide operating, maintenance and customer billing services related to the customers’ water system. The formal agreements outline the fee schedule for the services provided. The agreements typically call for a fee-per-service or a flat-rate amount per month. The Company satisfies its performance obligation of providing operating and maintenance services over time as services are rendered; as a result, the Company employs the invoice practical expedient and recognizes revenue in the amount that it has the right to invoice. Contract terms are generally short-term and, as a result, no separate financing component is recognized for its collections from customers, which generally require payment within 30 days of billing.
Other non-regulated revenue primarily relates to services for the design and installation of water mains and other water infrastructure for customers outside the regulated service areas and insurance program administration.
56
CALIFORNIA WATER SERVICE GROUP
Notes to Consolidated Financial Statements (Continued)
December 31, 2020, 2019, and 2018
Dollar amounts in thousands unless otherwise stated
2 SUMMARY OF SIGNIFICANT ACCOUNTING POLICIES (Continued)
The Company determines if an arrangement is a lease at inception. Generally, a lease agreement exists if the Company determines that the arrangement gives the lessee control over the use of an identified asset and obtains substantially all of the benefits from the identified asset.
Maturities of lease payments to be received are as follows:
| Year Ending December 31, | Operating Leases | ||||
| 2021 | $ | ||||
| 2022 | |||||
| 2023 | |||||
| 2024 | |||||
| 2025 | |||||
| Thereafter | |||||
Allowance for Credit Losses
The Company measures expected credit losses for Customer Receivables, Other Receivables, and Unbilled Revenue on an aggregated level. These receivables are generally trade receivables due in one year or less or expected to be billed and collected in one year or less. The expected credit losses for Other Receivables and Unbilled Revenue are inconsequential. Customer receivables include receivables for water and wastewater services provided to residential customers, business, industrial, public authorities, and other customers. The expected credit losses for business, industrial, public authorities, and other customers are inconsequential. The overall risks related to the Company’s receivables are low as water and wastewater services are seen as essential services. The estimate for the allowance for credit losses is based on a historical loss ratio, in conjunction with a qualitative assessment of elements that impact the collectability of receivables to determine if the allowance for credit losses should be further adjusted in accordance with the accounting guidance for credit losses. Management contemplates available current information such as changes in economic factors, regulatory matters, industry trends, payment options and programs available to customers, and the methods that the Company is able to utilize to ensure payment.
In 2020, the Company reviewed its allowance for credit losses utilizing a quantitative assessment, which included trend analysis of customer billing and collection, aging by customer class, and unemployment rates since the outbreak of COVID-19 in the first quarter of 2020. The Company also utilized a qualitative assessment, which considered the future collectability on customer outstanding balances, management's estimate of the cash recovery, and a general assessment of the economic conditions of the locations the Company serves due to the outbreak of COVID-19. The Company is complying with the CPUC requirements to suspend customer disconnections for non-payment and ceased agency collection activities, and anticipates this situation will continue until further notice. Based on the above assessments, the Company expects an increase in customer receivable write-offs as compared to historical experiences and adjusted its allowance for credit losses, accordingly.
57
CALIFORNIA WATER SERVICE GROUP
Notes to Consolidated Financial Statements (Continued)
December 31, 2020, 2019, and 2018
Dollar amounts in thousands unless otherwise stated
2 SUMMARY OF SIGNIFICANT ACCOUNTING POLICIES (Continued)
The following table presents the activity in the allowance for credit losses for the period ended December 31, 2020, 2019 and 2018.
| 2020 | 2019 | 2018 | |||||||||||||||
| Beginning Balance | $ | $ | |||||||||||||||
| Provision for credit loss expense | $ | ||||||||||||||||
| Write-offs | ( |
( |
$ | ( |
|||||||||||||
| Recoveries | $ | ||||||||||||||||
| Total ending allowance balance | $ | $ | $ | ||||||||||||||
Other Receivables
As of December 31, 2020 and 2019, other receivables were:
| 2020 | 2019 | ||||||||||
| Accounts receivables from developers | |||||||||||
| Income tax receivables | |||||||||||
| Other | |||||||||||
| Total other receivables | $ | $ | |||||||||
Utility Plant
Utility plant is carried at original cost when first constructed or purchased, or at fair value when acquired through acquisition. When depreciable plant is retired, the cost is eliminated from utility plant accounts and such costs are charged against accumulated depreciation. Maintenance of utility plant is charged to operating expenses as incurred. Maintenance projects are not accrued for in advance.
Intangible assets acquired as part of water systems purchased are recorded at fair value. All other intangibles have been recorded at cost and are amortized over their useful life.
The following table represents depreciable plant and equipment as of December 31:
| 2020 | 2019 | ||||||||||
| Equipment | $ | $ | |||||||||
| Office buildings and other structures | |||||||||||
| Transmission and distribution plant | |||||||||||
| Total | $ | $ | |||||||||
Depreciation of utility plant is computed on a straight-line basis over the assets' estimated useful lives including cost of removal of certain assets as follows:
| Useful Lives | |||||
| Equipment | |||||
| Transmission and distribution plant | |||||
| Office Buildings and other structures | |||||
The provision for depreciation expressed as a percentage of the aggregate depreciable asset balances was 2.94 % in 2020, 2.96 % in 2019, and 3.02 % in 2018.
58
CALIFORNIA WATER SERVICE GROUP
Notes to Consolidated Financial Statements (Continued)
December 31, 2020, 2019, and 2018
Dollar amounts in thousands unless otherwise stated
2 SUMMARY OF SIGNIFICANT ACCOUNTING POLICIES (Continued)
Allowance for funds used during construction (AFUDC)
The AFUDC represents the capitalized cost of funds used to finance the construction of the utility plant. In general, AFUDC is applied to Cal Water construction projects requiring more than one month to complete. No AFUDC is applied to projects funded by customer advances for construction, contributions in aid of construction, or applicable state-revolving fund loans. AFUDC includes the net cost of borrowed funds and a rate of return on other funds when used, and is recovered through water rates as the utility plant is depreciated.
The amount of AFUDC related to equity funds and to borrowed funds for 2020, 2019, and 2018 are shown in the table below:
| 2020 | 2019 | 2018 | |||||||||||||||
| Allowance for equity funds used during construction | $ | $ | $ | ||||||||||||||
| Allowance for borrowed funds used during construction | |||||||||||||||||
| Total | $ | $ | $ | ||||||||||||||
Asset Retirement Obligation
The Company has a legal obligation to retire wells in accordance with State Water Resources Control Board regulations. In addition, upon decommission of a wastewater plant or lift station certain wastewater infrastructure would need to be retired in accordance with State Water Resources Control Board regulations. An asset retirement cost and corresponding retirement obligation is recorded when a well or waste water infrastructure is placed into service. As of December 31, 2020 and 2019, the retirement obligation is estimated to be $27.8 million and $25.6 million, respectively. The retirement obligation is recorded as part of "Other long-term liabilities" within the Consolidated Balance Sheet. The change only impacted the consolidated balance sheets as the Company recognizes a regulatory asset or liability for the timing differences between the recognition of expenses and costs recovered through the ratemaking process.
The following table provides a reconciliation of cash, cash equivalents, and restricted cash within the Consolidated Balance Sheets that total to the amounts shown on the Consolidated Statements of Cash Flows:
| December 31, 2020 | December 31, 2019 | ||||||||||
| Cash and cash equivalents | |||||||||||
| Restricted cash (included in "taxes, prepaid expenses, and other assets") | |||||||||||
| Total cash, cash equivalents, and restricted cash shown in the statements of cash flows | $ | $ | |||||||||
59
CALIFORNIA WATER SERVICE GROUP
Notes to Consolidated Financial Statements (Continued)
December 31, 2020, 2019, and 2018
Dollar amounts in thousands unless otherwise stated
2 SUMMARY OF SIGNIFICANT ACCOUNTING POLICIES (Continued)
Regulatory Assets and Liabilities
Because the Company operates almost exclusively in a regulated business, the Company is subject to the accounting standards for regulated utilities. The Commissions in the states in which the Company operates establish rates that are designed to permit the recovery of the cost of service and a return on investment. The Company capitalizes and records regulatory assets for costs that would otherwise be charged to expense if it is probable that the incurred costs will be recovered in future rates. Regulatory assets are amortized over the future periods that the costs are expected to be recovered. If costs expected to be incurred in the future are currently being recovered through rates, the Company records those expected future costs as regulatory liabilities. In general, the Company does not earn a return on regulatory assets if the related costs do not accrue interest. Accordingly, the Company earns a return only on its regulatory assets for net WRAM and MCBA, PCBA, HCBA, and IRMA receivables. In addition, the Company records regulatory liabilities when the Commissions require a refund to be made to the Company's customers over future periods.
Determining probability requires significant judgment by management and includes, but is not limited to, consideration of testimony presented in regulatory hearings, proposed regulatory decisions, final regulatory orders, and the strength or status of applications for rehearing or state court appeals.
If the Company determines that a portion of the Company's assets used in utility operations is not recoverable in customer rates, the Company would be required to recognize the loss of the assets disallowed.
See Note 4 - Regulatory Assets and Liabilities for details of the Company's regulatory assets and liabilities.
The Company's long-lived assets include transmission and distribution plant, equipment, land, buildings, and intangible assets. Long-lived assets, other than land, are depreciated or amortized over their estimated useful lives, and are reviewed for impairment whenever changes in circumstances indicate the carrying value of the assets may not be recoverable. Such circumstances would include items such as a significant decrease in the market value of a long-lived asset, a significant adverse change in the manner in which the asset is being used or planned to be used or in its physical condition, or a history of operating or cash flow losses associated with the uses of the asset. In addition, changes in the expected useful life of these long-lived assets may also be an impairment indicator. When such events or changes occur, the Company estimates the fair value of the asset from future cash flows expected to result from the use and, if applicable, the eventual disposition of the assets, and compare that to the carrying value of the asset. If the carrying value is greater than the fair value, then an impairment loss is recognized equal to the amount by which the asset's carrying value exceeds its fair value. The key variables that must be estimated include assumptions regarding sales volume, rates, operating costs, labor and other benefit costs, capital additions, assumed discount rates and other economic factors. These variables require significant management judgment and include inherent uncertainties since they are forecasting future events. A variation in the assumptions used could lead to a different conclusion regarding the realizability of an asset and, thus could have a significant effect on the consolidated financial statements.
Goodwill is measured as the excess of the cost of an acquisition over the sum of the amounts assigned to identifiable assets acquired less liabilities assumed. Goodwill is not amortized but instead is reviewed annually at November 30th for impairment or more frequently if impairment indicators arise. The impairment test is performed at the reporting unit level using fair-value based approach in which the fair value of the reporting unit is compared to the reporting unit's carrying value. If the fair value of the reporting unit is less than its carrying amount, then an impairment loss is recognized equal to the difference.
60
CALIFORNIA WATER SERVICE GROUP
Notes to Consolidated Financial Statements (Continued)
December 31, 2020, 2019, and 2018
Dollar amounts in thousands unless otherwise stated
2 SUMMARY OF SIGNIFICANT ACCOUNTING POLICIES (Continued)
| Year Ending December 31, | Refunds of Advances | ||||
| 2021 | $ | ||||
| 2022 | |||||
| 2023 | |||||
| 2024 | |||||
| 2025 | |||||
| Thereafter | |||||
| Total refunds | $ | ||||
Contributions in Aid of Construction
Contributions in aid of construction represent payments received from developers, primarily for fire protection purposes, which are not subject to refunds. Facilities funded by contributions are included in utility plant, but excluded from rate base. Depreciation related to assets acquired from contributions is charged to the Contributions in Aid of Construction account.
Income Taxes
The Company accounts for income taxes using the asset and liability method. Deferred tax assets and liabilities are recognized for the future tax consequences attributable to differences between the financial statement carrying amounts of existing assets and liabilities and their respective tax basis. Measurement of the deferred tax assets and liabilities is at enacted tax rates expected to apply to taxable income in the years in which those temporary differences are expected to be recovered or settled. The effect on deferred tax assets and liabilities of a change in tax rates is recognized in the period that includes the enactment date. The Company evaluates the need for a valuation allowance on deferred tax assets based on historical taxable income and projected taxable income for future tax years.
Historically the Commissions reduced revenue requirements for the tax effects of certain originating temporary differences and allowed recovery of these tax costs as the related temporary differences reverse. The Commissions have granted the Company rate increases to reflect the normalization of the tax benefits of the federal accelerated methods and available Investment Tax Credits (ITC) for all assets placed in service after 1980. ITCs are deferred and amortized over the lives of the related properties for book purposes. The CPUC sets rates utilizing the flow through method of accounting for state income taxes.
With the enactment of the TCJA, Contributions in Aid of Construction received from developers after December 22, 2017 became taxable for federal income tax purposes.
61
CALIFORNIA WATER SERVICE GROUP
Notes to Consolidated Financial Statements (Continued)
December 31, 2020, 2019, and 2018
Dollar amounts in thousands unless otherwise stated
2 SUMMARY OF SIGNIFICANT ACCOUNTING POLICIES (Continued)
Earnings per Share
The computations of basic and diluted earnings per share are noted below. Basic earnings per share are computed by dividing net income available to common stockholders by the weighted average number of common shares outstanding during the period. Diluted earnings per share reflect the potential dilution that could occur if securities or other contracts were exercised or converted into common stock. Restricted Stock Awards (RSAs) are included in the common shares outstanding because the shares have all the same voting and dividend rights as issued and unrestricted common stock. Restricted Stock Unit Awards (RSUs) are not included in diluted shares for financial reporting until authorized by the Organization & Compensation Committee of the Board of Directors.
| 2020 | 2019 | 2018 | |||||||||||||||
| (In thousands, except per share data) |
|||||||||||||||||
| Net income available to common stockholders | $ | $ | $ | ||||||||||||||
| Weighted average common shares, basic | |||||||||||||||||
| Weighted average common shares, dilutive | |||||||||||||||||
| Earnings per share—basic | $ | $ | $ | ||||||||||||||
| Earnings per share—diluted | $ | $ | $ | ||||||||||||||
Stock-based Compensation
Stock-based compensation cost is measured at the grant date based on the fair value of the award. The Company recognizes compensation expense on a straight-line basis over the requisite service period, which is the vesting period.
Comprehensive Income or Loss
Comprehensive income for all periods presented was the same as net income.
Accumulated Other Comprehensive Income
The Company did not have any accumulated other comprehensive income or loss transactions as of December 31, 2020 and 2019.
Adoption of New Accounting Standards in 2020
In June of 2016, the FASB issued ASU 2016-13, Financial Instruments - Credit Losses (Topic 326): Measurement of Credit Losses on Financial Instruments, which changed the impairment model for certain financial assets that have a contractual right to receive cash, including trade and loan receivables. The new model required recognition based upon an estimation of expected credit losses rather than recognition of losses when it is probable that they have been incurred. ASU 2016-13 was effective for annual reporting periods beginning after December 15, 2019, with early adoption permitted. The Company adopted the standard utilizing the modified retrospective method for its trade receivables, unbilled revenue, and other receivables on January 1, 2020. Based on the composition of the Company’s trade receivables, unbilled revenue, and other receivables and expected future losses, the adoption of ASU 2016-13 did not have a material impact on its consolidated financial statements.
In January of 2017, the FASB issued ASU 2017-04, Intangibles - Goodwill and Other (Topic 350): Simplifying the Test for Goodwill Impairment, which eliminated the second step of the goodwill impairment test that required a hypothetical purchase price allocation to measure goodwill impairment. Under the new guidance, a goodwill impairment loss will be measured at the amount by which a reporting unit’s carrying amount exceeds its fair value, not to exceed the carrying amount of goodwill. ASU 2017-04 was effective for annual reporting periods beginning after December 15, 2019, with early adoption permitted for any impairment test performed on testing dates after January 1, 2017. The Company adopted the standard on January 1, 2020 and the adoption of the standard did not have a material impact on its consolidated financial statements.
62
CALIFORNIA WATER SERVICE GROUP
Notes to Consolidated Financial Statements (Continued)
December 31, 2020, 2019, and 2018
Dollar amounts in thousands unless otherwise stated
2 SUMMARY OF SIGNIFICANT ACCOUNTING POLICIES (Continued)
In August of 2018, the FASB issued ASU 2018-13, Fair Value Measurement (Topic 820): Disclosure Framework - Changes to the Disclosure for Fair Value Measurement, which modified the disclosure requirements on fair value measurements. The modifications in this update eliminated, amended, and added disclosure requirements for fair value measurements. ASU 2018-13 was effective for annual reporting periods beginning after December 15, 2019, with early adoption permitted. The Company adopted the standard in part prospectively and in part retrospectively, in accordance with the requirements of ASU 2018-13, on January 1, 2020. Since the Company does not have level 3 fair value measurements or transfers between level 1 and level 2 fair value measurements, the adoption of the standard did not have a material impact on its footnote disclosures.
In August of 2018, the FASB issued ASU No. 2018-14, an amendment to ASC 715, Compensation - Retirement Benefits - General (subtopic 715-20) Disclosure Framework: Changes to the Disclosure Requirements for Defined Benefit Plans, which modifies the disclosures required for defined benefit pension and other postretirement benefit plans. ASU 2018-14 removed disclosures that are no longer considered cost-beneficial, clarified the specific requirements of certain disclosures and added new disclosure requirements identified as relevant. The guidance was effective for fiscal years ending after December 15, 2020, with early adoption permitted. The Company adopted the standard in 2020 and applied the amendments to the footnote disclosures on a retrospective basis. The amendments did not have material impact on the Company's footnote disclosures.
3 OTHER INCOME AND EXPENSES
The Company conducts various non-regulated activities as reflected in the table below:
| 2020 | 2019 | 2018 | |||||||||||||||||||||||||||||||||
| Revenue | Expense | Revenue | Expense | Revenue | Expense | ||||||||||||||||||||||||||||||
| Operating and maintenance | $ | $ | $ | $ | $ | $ | |||||||||||||||||||||||||||||
| Leases | |||||||||||||||||||||||||||||||||||
| Design and construction | |||||||||||||||||||||||||||||||||||
| Meter reading and billing | |||||||||||||||||||||||||||||||||||
| Interest income | |||||||||||||||||||||||||||||||||||
| Change in value of life insurance contracts (gain) loss | ( |
( |
|||||||||||||||||||||||||||||||||
| Other non-regulated income and expenses | |||||||||||||||||||||||||||||||||||
| Total | $ | $ | $ | $ | $ | $ | |||||||||||||||||||||||||||||
63
CALIFORNIA WATER SERVICE GROUP
Notes to Consolidated Financial Statements (Continued)
December 31, 2020, 2019, and 2018
Dollar amounts in thousands unless otherwise stated
4 REGULATORY ASSETS AND LIABILITIES
Regulatory assets and liabilities were comprised of the following as of December 31:
| Recovery Period | 2020 | 2019 | |||||||||||||||
| Regulatory Assets | |||||||||||||||||
| Pension and retiree group health | Indefinitely | $ | $ | ||||||||||||||
| Property-related temporary differences (tax benefits flowed through to customers) | Indefinitely | ||||||||||||||||
| Other accrued benefits | Indefinitely | ||||||||||||||||
| Net WRAM and MCBA long-term accounts receivable | |||||||||||||||||
| Asset retirement obligations, net | Indefinitely | ||||||||||||||||
| IRMA long-term accounts receivable | |||||||||||||||||
| Tank coating | |||||||||||||||||
| Recoverable property losses | |||||||||||||||||
| PCBA | |||||||||||||||||
| Other components of net periodic benefit cost | Indefinitely | ||||||||||||||||
| General district balancing account receivable | |||||||||||||||||
| Low-income rate assistance (LIRA) and Rate support fund (RSF) accounts receivable | |||||||||||||||||
| Other regulatory assets | Various | ||||||||||||||||
| Total Regulatory Assets | $ | $ | |||||||||||||||
| Regulatory Liabilities | |||||||||||||||||
| Future tax benefits due to customers | $ | $ | |||||||||||||||
| Retiree group health | |||||||||||||||||
| HCBA | |||||||||||||||||
| Conservation program | |||||||||||||||||
| Net WRAM and MCBA long-term payable | |||||||||||||||||
| 1,2,3 trichloropropane settlement proceeds | |||||||||||||||||
| Other regulatory liabilities | |||||||||||||||||
| Total Regulatory Liabilities | $ | $ | |||||||||||||||
The PCBA regulatory asset and the HCBA regulatory liability represent incurred pension and healthcare costs that exceeded/was below the cost recovery in rates and is recoverable/refundable from/to customers. The other components of net periodic benefit cost regulatory asset are authorized by the Commissions and are probable for rate recovery through the capital program.
The property-related temporary differences are primarily due to: (i) the difference between book and federal income tax depreciation on utility plant that was placed in service before the regulatory Commissions adopted normalization for rate making purposes; and (ii) certain (state) deferred taxes for which flow through accounting continues to be applied to originating deferred taxes. The regulatory asset will be recovered in rates in future periods as the tax effects of the temporary differences previously flowed-through to customers reverse.
64
CALIFORNIA WATER SERVICE GROUP
Notes to Consolidated Financial Statements (Continued)
December 31, 2020, 2019, and 2018
Dollar amounts in thousands unless otherwise stated
4 REGULATORY ASSETS AND LIABILITIES (Continued)
Other accrued benefits are accrued benefits for vacation, self-insured workers' compensation, and directors' retirement benefits. The net WRAM and MCBA long-term accounts receivable is the under-collected portion of recorded revenues that are not expected to be collected from customers within 12 months. The IRMA long-term accounts receivables is the additional amount the Company would have billed customers in 2020 had the 2018 GRC been approved on time.
The asset retirement obligation regulatory asset represents the difference between costs associated with asset retirement obligations and amounts collected in rates. Tank coating represents the maintenance costs for tank coating projects that are recoverable from customers.
The LIRA and RSF are two programs offered by Cal Water that assist qualifying customers with their monthly water bill. The programs are funded by the customers who do not qualify for the assistance. The LIRA and RSF regulatory assets represent the amounts due from customers to fund the LIRA and RSF credits that were provided to assist qualifying customers.
The future tax benefits due to customers primarily resulted from federal tax law changes enacted by the federal Tax Cuts and Jobs Act (TCJA) on December 22, 2017. The TCJA reduced the federal corporate income tax rate from 35 percent to 21 percent beginning on January 1, 2018, and GAAP requires the Company to re-measure all existing deferred income tax assets and liabilities to reflect the reduction in the federal tax rate on the enactment date.
The conservation program regulatory liability is for incurred conservation costs that were below the cost recovery in rates and is refundable to customers.
1,2,3 trichloropropane (TCP) settlement proceeds are discussed in Note 15.
Short-term regulatory assets and liabilities are excluded from the above table. The short-term regulatory assets for 2020 and 2019 were $96.2 million and $38.2 million, respectively. The short-term regulatory assets, as of December 31, 2020, primarily consist of net WRAM and MCBA, IRMA, and PCBA receivables. As of December 31, 2019, the short-term regulatory assets consisted of net WRAM and MCBA receivables.
The short-term portion of regulatory liabilities for 2020 and 2019 were $34.6 million and $4.5 million, respectively. The short-term regulatory liabilities as of December 31, 2020, primarily consist of TCJA and HCBA refunds and TCP settlement proceeds. As of December 31, 2019, the short-term regulatory liabilities primarily consist of TCP settlement proceeds, tax accounting memorandum account refunds, and cost of capital memorandum account refunds
5 INTANGIBLE ASSETS
As of December 31, 2020 and 2019, intangible assets that will continue to be amortized and those not amortized were:
| Weighted Average Amortization Period (years) |
2020 | 2019 | |||||||||||||||||||||||||||||||||||||||
| Gross Carrying Value |
Accumulated Amortization |
Net Carrying Value |
Gross Carrying Value |
Accumulated Amortization |
Net Carrying Value |
||||||||||||||||||||||||||||||||||||
| Amortized intangible assets: | |||||||||||||||||||||||||||||||||||||||||
| Water pumping rights | usage | $ | $ | $ | $ | $ | $ | ||||||||||||||||||||||||||||||||||
| Water planning studies | |||||||||||||||||||||||||||||||||||||||||
| Leasehold improvements and other | |||||||||||||||||||||||||||||||||||||||||
| Total | $ | $ | $ | $ | $ | $ | |||||||||||||||||||||||||||||||||||
| Unamortized intangible assets: | |||||||||||||||||||||||||||||||||||||||||
| Perpetual water rights and other | $ | $ | — | $ | $ | $ | — | $ | |||||||||||||||||||||||||||||||||
Water pumping rights usage is the amount of water pumped from aquifers to be treated and distributed to customers.
For the year ended December 31, 2020, 2019, and 2018, amortization of intangible assets was $1.1 million, $1.5 million, $1.7 million, respectively.
65
CALIFORNIA WATER SERVICE GROUP
Notes to Consolidated Financial Statements (Continued)
December 31, 2020, 2019, and 2018
Dollar amounts in thousands unless otherwise stated
5 INTANGIBLE ASSETS (Continued)
Estimated future amortization expense related to intangible assets are shown in the table below:
| Year Ending December 31, | Estimated Future Amortization Expense Related to Intangible Assets | ||||
| 2021 | $ | ||||
| 2022 | |||||
| 2023 | |||||
| 2024 | |||||
| 2025 | |||||
| Thereafter | |||||
| Total | $ | ||||
6 PREFERRED STOCK
On February 27, 2019, the Company filed with the Delaware Secretary of State a Certificate of Elimination of Series D Participating Preferred Stock, which returned the 221,000 shares that had previously been designated as Series D Preferred Stock but had never been issued to the status of preferred shares of the Company, without designation as to series.
The foregoing summary of the Certificate of Elimination is qualified in its entirety by reference to the full text of the Certificate of Elimination, a copy of which is attached as Exhibit 4.2.
7 COMMON STOCKHOLDERS' EQUITY
As of December 31, 2020 and 2019, 50,333,655 shares and 48,532,199 shares, respectively, of common stock were issued and outstanding.
Effective January 1, 2019, the Company implemented an Employee Stock Purchase Plan (ESPP). Under the ESPP, qualified employees are permitted to purchase the Company’s common stock at 90 % of the market value of the common stock on the specified stock purchase date. The ESPP is deemed compensatory and compensation costs will be accounted for under ASC 718, Stock Compensation. Employees’ payroll deductions for common stock purchases may not exceed 10 % of their salaries. Employees may purchase up to 2,000 shares per period provided that the value of the shares purchased in any calendar year may not exceed $25,000 , as calculated pursuant to the ESPP. The Company's recorded expense was $0.2 million for 2020 and 2019. The Company has issued 43,332 and 35,281 shares of common stock related to the ESPP in 2020 and 2019, respectively.
On October 31, 2019, the Company entered into an equity distribution agreement to sell shares of its common stock having an aggregate gross sales price of up to $300.0 million from time to time depending on market conditions through an at-the-market equity program over the next three years . The Company intends to use the net proceeds from these sales, after deducting commissions on such sales and offering expenses, for general corporate purposes, which may include working capital, construction and acquisition expenditures, investments and repurchases, and redemptions of securities. In 2020, the Company sold 1,710,779 shares of common stock through the at-the-market equity program and raised proceeds of $81.8 million net of $0.8 million in commissions paid under the equity distribution agreement. In 2019, the Company sold 381,105 shares of common stock through the at-the-market equity program and raised proceeds of $19.3 million net of $0.2 million in commissions paid under the equity distribution agreement. The Company also incurred $0.1 million and $0.5 million of equity issuance costs in 2020 and 2019, respectively.
Dividend Reinvestment and Stock Repurchase Plan
The Company has a Dividend Reinvestment and Stock Purchase Plan (DRIP Plan). Under the DRIP Plan, stockholders may reinvest dividends to purchase additional Company common stock without commission fees. The DRIP Plan also allows existing stockholders and other interested investors to purchase Company common stock through the transfer agent up to certain limits. The Company's transfer agent operates the DRIP Plan and purchases shares on the open market to provide shares for the DRIP Plan.
66
CALIFORNIA WATER SERVICE GROUP
Notes to Consolidated Financial Statements (Continued)
December 31, 2020 and 2019
Dollar amounts in thousands unless otherwise stated
8 SHORT-TERM BORROWINGS
On March 29, 2019, the Company and Cal Water entered into certain syndicated credit agreements, which provide for unsecured revolving credit facilities of up to an initial aggregate amount of $550.0 million for a term of five years . The revolving credit facilities amend, expand, and replace the Company’s and its subsidiaries’ prior credit facilities originally entered into on May 10, 2015. The new credit facilities extended the terms until March 29, 2024, and increased Cal Water’s unsecured revolving line of credit. The Company and subsidiaries that it designates may borrow up to $150.0 million under the Company’s revolving credit facility. Cal Water may borrow up to $400.0 million under its revolving credit facility. All borrowings must be repaid within 24 months unless a different period is required or authorized by the CPUC. Additionally, the credit facilities may be increased by up to an incremental $150.0 million under the Cal Water facility and $50.0 million under the Company facility, subject in each case to certain conditions. The proceeds from the revolving credit facilities may be used for working capital purposes, including the short-term financing of capital projects. Borrowings under the credit facilities typically have maturities varying between and six months and will bear interest annually at a rate equal to (i) the base rate or (ii) the Eurodollar rate, plus an applicable margin of 0.650 % to 0.875 %, depending on the Company and its subsidiaries’ consolidated total capitalization ratio.
The revolving credit facilities contain affirmative and negative covenants and events of default customary for credit facilities of this type including, among other things, limitations and prohibitions relating to additional indebtedness, liens, mergers, and asset sales. Also, these unsecured credit agreements contain financial covenants governing the Company and its subsidiaries' consolidated total capitalization ratio and interest coverage ratio.
As of December 31, 2020 and 2019, the outstanding borrowings on the Company lines of credit were $100.0 million and $55.1 million, respectively. The borrowings on the Cal Water lines of credit was $270.0 million and $120.0 million as of December 31, 2020 and 2019, respectively. The average borrowing rate for borrowings on the Company and Cal Water lines of credit during 2020 was 1.54 % compared to 3.23 % for the same period last year.
67
CALIFORNIA WATER SERVICE GROUP
Notes to Consolidated Financial Statements (Continued)
December 31, 2020 and 2019
Dollar amounts in thousands unless otherwise stated
9 LONG-TERM DEBT
As of December 31, 2020 and 2019, long-term debt outstanding was:
| Series | Interest Rate | Maturity Date | 2020 | 2019 | |||||||||||||||||||||||||
| First Mortgage Bonds | YYY | % | 2059 | $ | $ | ||||||||||||||||||||||||
| WWW | % | 2049 | |||||||||||||||||||||||||||
| VVV | % | 2029 | |||||||||||||||||||||||||||
| TTT | % | 2056 | |||||||||||||||||||||||||||
| SSS | % | 2046 | |||||||||||||||||||||||||||
| QQQ | % | 2025 | |||||||||||||||||||||||||||
| RRR | % | 2045 | |||||||||||||||||||||||||||
| PPP | % | 2040 | |||||||||||||||||||||||||||
| AAA | % | 2025 | |||||||||||||||||||||||||||
| BBB | % | 2028 | |||||||||||||||||||||||||||
| CCC | % | 2030 | |||||||||||||||||||||||||||
| DDD | % | 2031 | |||||||||||||||||||||||||||
| EEE | % | 2032 | |||||||||||||||||||||||||||
| GGG | % | 2022 | |||||||||||||||||||||||||||
| HHH | % | 2022 | |||||||||||||||||||||||||||
| III | % | 2023 | |||||||||||||||||||||||||||
| OOO | % | 2031 | |||||||||||||||||||||||||||
| CC | % | 2020 | |||||||||||||||||||||||||||
| Total First Mortgage Bonds | |||||||||||||||||||||||||||||
| California Department of Water Resources Loans | 2027 - 2039 |
||||||||||||||||||||||||||||
| Other long-term debt | |||||||||||||||||||||||||||||
| Unamortized debt issuance costs | ( |
( |
|||||||||||||||||||||||||||
| Total long-term debt, net of unamortized debt issuance costs | |||||||||||||||||||||||||||||
| Less current maturities of long-term debt, net | |||||||||||||||||||||||||||||
| Long-term debt, net | $ | $ | |||||||||||||||||||||||||||
On June 11, 2019, Cal Water completed the sale and issuance of $400.0 million in aggregate principal amount of First Mortgage Bonds (the bonds) in a private placement. The bonds consist of $100.0 million of 3.40 % bonds, series VVV, maturing June 11, 2029; $100.0 million of 4.07 % bonds, series WWW, maturing June 11, 2049; and $200.0 million of 4.17 % bonds, series YYY, maturing June 11, 2059. Interest on the bonds will accrue semi-annually and be payable in arrears. The bonds will rank equally with all of Cal Water’s other First Mortgage Bonds and will be secured by liens on Cal Water’s properties, subject to certain exceptions and permitted liens. Cal Water used the net proceeds from the sale of the bonds to pay down outstanding short-term borrowings and to redeem $300.0 million of bond series UUU. The bonds were not registered under the Securities Act of 1933 and may not be offered or sold in the United States absent registration or an applicable exemption from registration requirements.
On October 4, 2011, Cal Water entered into a capital lease arrangement with the City of Hawthorne to operate the City's water system for a 15-year period. The $4.6 million and $5.2 million capital lease liability as of December 31, 2020 and 2019, respectively, is included in other long-term debt and current maturities set forth above.
68
CALIFORNIA WATER SERVICE GROUP
Notes to Consolidated Financial Statements (Continued)
December 31, 2020, 2019, and 2018
Dollar amounts in thousands unless otherwise stated
10 OTHER ACCRUED LIABILITIES
As of December 31, 2020 and 2019, other accrued liabilities were:
| 2020 | 2019 | ||||||||||
| Accrued and deferred compensation | $ | $ | |||||||||
| Accrued benefits and workers' compensation claims | |||||||||||
| Unearned revenue and customer deposits | |||||||||||
| Due to contracts and agencies | |||||||||||
| Current portion of operating lease | |||||||||||
| Other | |||||||||||
| Total other accrued liabilities | $ | $ | |||||||||
11 INCOME TAXES
Income tax expense (benefit) consisted of the following:
| Federal | State | Total | |||||||||||||||
| 2020 | |||||||||||||||||
| Current | $ | $ | $ | ||||||||||||||
| Deferred | ( |
||||||||||||||||
| Total income tax | $ | $ | ( |
$ | |||||||||||||
| 2019 | |||||||||||||||||
| Current | $ | $ | $ | ||||||||||||||
| Deferred | |||||||||||||||||
| Total income tax | $ | $ | $ | ||||||||||||||
| 2018 | |||||||||||||||||
| Current | $ | $ | $ | ||||||||||||||
| Deferred | ( |
||||||||||||||||
| Total income tax | $ | $ | ( |
$ | |||||||||||||
The Company's 2020, 2019 and 2018 qualified tax repairs and maintenance deductions totaled $164.0 million, $70.0 million, and $102.0 million, respectively.
At December 31, 2020, the Company had U.S. federal and U.S. state tax net operating loss carryforwards of approximately $140.8 million and $181.3 million respectively. The U.S. federal and U.S. state net operating loss carryforwards will expire at various dates beginning in tax years 2027 and 2028, respectively.
As of December 31, 2020, the California Enterprise Zone (EZ) credit was $4.2 million net of federal tax benefit for qualified property purchased before January 1, 2015, and placed in service before January 1, 2016. The Company has carry-forward California EZ credits of $2.2 million net of federal tax benefit. Unused State of California EZ credits can carry-forward until 2024.
69
CALIFORNIA WATER SERVICE GROUP
Notes to Consolidated Financial Statements (Continued)
December 31, 2020, 2019, and 2018
Dollar amounts in thousands unless otherwise stated
11 INCOME TAXES (Continued)
The difference between the recorded and the statutory income tax expense is reconciled in the table below:
| 2020 | 2019 | 2018 | |||||||||||||||
| Statutory income tax | $ | $ | $ | ||||||||||||||
| Increase (reduction) in taxes due to: | |||||||||||||||||
| State income taxes net of federal tax benefit | |||||||||||||||||
| Effect of regulatory treatment of fixed asset differences | ( |
( |
( |
||||||||||||||
| Investment tax credits | ( |
( |
( |
||||||||||||||
| AFUDC equity | ( |
( |
( |
||||||||||||||
| Share based stock compensation | ( |
||||||||||||||||
| TCJA refund | ( |
||||||||||||||||
| Other | |||||||||||||||||
| Total income tax | $ | $ | $ | ||||||||||||||
The effect of regulatory treatment of fixed asset differences includes estimated repair and maintenance deductions and asset related flow through items.
On December 22, 2017, the U.S. government enacted expansive tax legislation commonly referred to as the TCJA. Among other provisions, the TCJA reduces the federal income tax rate from 35 percent to 21 percent beginning on January 1, 2018 and eliminated bonus depreciation for utilities. The TCJA required the Company to re-measure all existing deferred income tax assets and liabilities to reflect the reduction in the federal tax rate. A TCJA refund of $108.0 million was recorded on December 31, 2017.
During 2020, the Company analyzed its deferred tax balances, tax regulatory asset and tax regulatory liability based on 2018 GRC approved rates. As of December 31, 2020, the TCJA refund was $105.0 million. The Company continued working with other state regulators to finalize the refund to ensure compliance with federal normalization rules.
70
CALIFORNIA WATER SERVICE GROUP
Notes to Consolidated Financial Statements (Continued)
December 31, 2020, 2019, and 2018
Dollar amounts in thousands unless otherwise stated
11 INCOME TAXES (Continued)
The deferred tax assets and deferred tax liabilities as of December 31, 2020 and 2019, are presented in the following table:
| 2020 | 2019 | ||||||||||
| Deferred tax assets: | |||||||||||
| Developer deposits for contributions in aid of construction | $ | $ | |||||||||
| Net operating loss carryforward and tax credits | |||||||||||
| Pension liability | |||||||||||
| Income tax regulatory liability | |||||||||||
| Operating leases liabilities | |||||||||||
| Other | |||||||||||
| Total deferred tax assets | |||||||||||
| Deferred tax liabilities: | |||||||||||
| Property related basis and depreciation differences | |||||||||||
| WRAM/MCBA and interim rates balancing accounts | |||||||||||
| Operating lease-right to use asset | |||||||||||
| Other | |||||||||||
| Total deferred tax liabilities | |||||||||||
| Net deferred tax liabilities | $ | $ | |||||||||
A valuation allowance was not required at December 31, 2020 and 2019. Based on historical taxable income and future taxable income projections over the period in which the deferred assets are deductible, management believes it is more likely than not that the Company will realize the benefits of the deductible differences.
The following table reconciles the changes in unrecognized tax benefits:
| December 31, 2020 | December 31, 2019 | December 31, 2018 | |||||||||||||||
| Balance at beginning of year | $ | $ | $ | ||||||||||||||
| Additions for tax positions taken during current year | |||||||||||||||||
| Reduction to prior year tax position | ( |
||||||||||||||||
| Balance at end of year | $ | $ | $ | ||||||||||||||
The Company does not expect a material change in its unrecognized tax benefits within the next 12 months. The component of unrecognized tax benefits that, if recognized, would affect the effective tax rate as of December 31, 2020, was $3.7 million, with the remaining balance representing the potential deferral of taxes to later years.
The Company's federal income tax years subject to an examination are from 2013 to 2020 and the state income tax years subject to an examination are from 2012 to 2020.
71
CALIFORNIA WATER SERVICE GROUP
Notes to Consolidated Financial Statements (Continued)
December 31, 2020, 2019, and 2018
Dollar amounts in thousands unless otherwise stated
12 EMPLOYEE BENEFIT PLANS
Savings Plan
The Company sponsors a 401(k) qualified defined contribution savings plan that allows participants to contribute up to 20 % of pre-tax compensation. Effective January 1, 2010, the Company matches 75 cents for each dollar contributed by the employee up to a maximum Company match of 6.0 % of base salary. Company contributions were $6.5 million for the years 2020 and 2019, respectively, and $6.0 million for 2018.
Pension Plans
The Company provides a qualified, defined-benefit, non-contributory pension plan for substantially all employees. The accumulated benefit obligations of the pension plan are $622.0 million and $615.5 million as of December 31, 2020 and 2019, respectively. The fair value of pension plan assets was $716.8 million and $573.6 million as of December 31, 2020 and 2019, respectively.
Prior to 2010, pension payment obligations were generally funded by the purchase of an annuity from a life insurance company. Beginning in 2010, the pension plan trust pays monthly benefits to retirees, rather than the purchase of an annuity.
The Company also maintains an unfunded, non-qualified, supplemental executive retirement plan (SERP). The unfunded SERP accumulated benefit obligations were $78.0 million and $71.8 million as of December 31, 2020 and 2019, respectively. Benefit payments under the supplemental executive retirement plan are paid currently.
Expected payments to be made for the pension and SERP plans are shown in the table below:
| Year Ending December 31, | Pension | SERP | Total | ||||||||||||||
| 2021 | $ | $ | $ | ||||||||||||||
| 2022 | |||||||||||||||||
| 2023 | |||||||||||||||||
| 2024 | |||||||||||||||||
| 2025 | |||||||||||||||||
| 2026-2030 | |||||||||||||||||
| Total payments | $ | $ | $ | ||||||||||||||
The expected benefit payments are based upon the same assumptions used to measure the Company's benefit obligation at December 31, 2020, and include estimated future employee service.
The costs of the pension and retirement plans are charged to expense and utility plant. The Company makes annual contributions to fund the amounts accrued for pension cost.
Other Postretirement Plan
The Company provides substantially all active, permanent employees with medical, dental, and vision benefits through a self-insured plan. Employees retiring at or after age 58 , along with their spouses and dependents, continue participation in the plan by payment of a premium. Plan assets are invested in mutual funds, short-term money market instruments and commercial paper based upon a similar asset mix to the pension plan. Retired employees are also provided with a $10,000 dollar life insurance benefit.
The Company records the costs of postretirement benefits other than pensions (PBOP) during the employees' years of active service. Postretirement benefit expense recorded in 2020, 2019, and 2018, was $5.2 million, $7.9 million, and $8.8 million, respectively. The remaining net periodic benefit cost was $1.5 million at December 31, 2020, and is being recovered through future customer rates and is recorded as a regulatory asset.
72
CALIFORNIA WATER SERVICE GROUP
Notes to Consolidated Financial Statements (Continued)
December 31, 2020, 2019, and 2018
Dollar amounts in thousands unless otherwise stated
12 EMPLOYEE BENEFIT PLANS (Continued)
The expected benefit payments, net of retiree premiums and Medicare Part D subsidies, are shown in the table below.
| Year Ending December 31, | Expected Benefit Payments Before Medicare Part D Subsidy |
Effect of Medicare Part D Subsidy on Expected Benefit Payments | Expected Benefit Payments Net of Medicare Part D Subsidy | |||||||||||||||||
| 2021 | $ | $ | ( |
$ | ||||||||||||||||
| 2022 | ( |
|||||||||||||||||||
| 2023 | ( |
|||||||||||||||||||
| 2024 | ( |
|||||||||||||||||||
| 2025 | ( |
|||||||||||||||||||
| 2026-2030 | ( |
|||||||||||||||||||
| Total payments | $ | $ | ( |
$ | ||||||||||||||||
Benefit Plan Assets
The Company actively manages pensions and PBOP trust (Plan) assets. The Company's investment objectives are:
•Maximize the return on the assets, commensurate with the risk that the Company deems appropriate to meet the obligations of the Plans, minimize the volatility of the pension expense, and account for contingencies;
•Generate a rate of return for the total portfolio that equals or exceeds the actuarial investment rate assumption;
Additionally, the rate of return of the total fund is measured periodically against an index comprised of 35 % of the Standard & Poor's Index, 15 % of the Russell 2000 Index, 10 % of the MSCI EAFE Index, and 40 % of the Bloomberg Barclays U.S. Aggregate Bond Index. The index is consistent with the Company's rate of return objective and indicates the Company's long-term asset allocation objective.
The Company applies a risk management framework for managing the risks associated with employee benefit plan trust assets. The guiding principles of this risk management framework are the clear articulation of roles and responsibilities, appropriate delegation of authority, and proper accountability and documentation. Trust investment policies and investment manager guidelines include provisions to ensure prudent diversification, manage risk through appropriate use of physical direct asset holdings and derivative securities, and identify permitted and prohibited investments.
The Company's target asset allocation percentages for major categories of the pension plan are reflected in the table below:
| Minimum Exposure |
Target | Maximum Exposure |
|||||||||||||||
| Fixed Income | % | % | % | ||||||||||||||
| Total Domestic Equity: | % | % | % | ||||||||||||||
Small/Mid Cap Stocks |
% | % | % | ||||||||||||||
Large Cap Stocks |
% | % | % | ||||||||||||||
| Non-U.S. Equities | % | % | % | ||||||||||||||
The fixed income category includes money market funds, short-term bond funds, and cash. The majority of fixed income investments range in maturities from less than 1 to 5 years.
The Company's target allocation percentages for the PBOP trust is similar to the pension plan.
73
CALIFORNIA WATER SERVICE GROUP
Notes to Consolidated Financial Statements (Continued)
December 31, 2020, 2019, and 2018
Dollar amounts in thousands unless otherwise stated
12 EMPLOYEE BENEFIT PLANS (Continued)
The Company uses the following criteria to select investment funds:
•Fund past performance;
•Fund meets criteria of Employee Retirements Income Security Act (ERISA);
•Timeliness and completeness of fund communications and reporting to investors;
•Stability of fund management company;
•Fund management fees; and
•Administrative costs incurred by the Plan.
Plan Fair Value Measurements
The fair value measurements standard establishes a framework for measuring fair value. That framework provides a fair value hierarchy that prioritizes the inputs to valuation techniques used to measure fair value. The hierarchy gives the highest priority to unadjusted quoted prices in active markets for identical assets or liabilities (level 1 measurements) and the lowest priority to unobservable inputs (level 3 measurements). The three levels of the fair value hierarchy under the standard are described below:
Level 1—Inputs to the valuation methodology are unadjusted quoted prices for identical assets or liabilities in active markets that the Plan has the ability to access.
Level 2—Inputs to the valuation methodology include:
•Quoted market prices for similar assets or liabilities in active markets;
•Quoted prices for identical or similar assets or liabilities in inactive markets;
•Inputs other than quoted prices that are observable for the asset or liability; and
•Inputs that are derived principally from or corroborated by observable market data by correlation or other means.
If the asset or liability has a specified (contractual) term, the level 2 input must be observable for substantially the full term of the asset or liability.
Level 3—Inputs to the valuation methodology are unobservable and significant to the fair value measurement.
74
CALIFORNIA WATER SERVICE GROUP
Notes to Consolidated Financial Statements (Continued)
December 31, 2020, 2019, and 2018
Dollar amounts in thousands unless otherwise stated
12 EMPLOYEE BENEFIT PLANS (Continued)
The following tables present the fair value of plan assets by major asset category at December 31, 2020 and 2019:
| December 31, 2020 | |||||||||||||||||||||||||||||||||||||||||||||||
| Pension Benefits | Other Benefits | ||||||||||||||||||||||||||||||||||||||||||||||
| Level 1 | Level 2 | Level 3 | Total | Level 1 | Level 2 | Level 3 | Total | ||||||||||||||||||||||||||||||||||||||||
| Fixed Income | $ | $ | $ | $ | $ | $ | $ | $ | |||||||||||||||||||||||||||||||||||||||
| Domestic Equity: Small/Mid Cap Stocks | |||||||||||||||||||||||||||||||||||||||||||||||
| Domestic Equity: Large Cap Stocks | |||||||||||||||||||||||||||||||||||||||||||||||
| Non U.S. Equities | |||||||||||||||||||||||||||||||||||||||||||||||
| Assets measured at net asset value (NAV) | |||||||||||||||||||||||||||||||||||||||||||||||
| Total Plan Assets | $ | $ | $ | $ | $ | $ | $ | $ | |||||||||||||||||||||||||||||||||||||||
| December 31, 2019 | |||||||||||||||||||||||||||||||||||||||||||||||
| Pension Benefits | Other Benefits | ||||||||||||||||||||||||||||||||||||||||||||||
| Level 1 | Level 2 | Level 3 | Total | Level 1 | Level 2 | Level 3 | Total | ||||||||||||||||||||||||||||||||||||||||
| Fixed Income | $ | $ | $ | $ | $ | $ | $ | $ | |||||||||||||||||||||||||||||||||||||||
| Domestic Equity: Small/Mid Cap Stocks | |||||||||||||||||||||||||||||||||||||||||||||||
| Domestic Equity: Large Cap Stocks | |||||||||||||||||||||||||||||||||||||||||||||||
| Non U.S. Equities | |||||||||||||||||||||||||||||||||||||||||||||||
| Assets measured at NAV | |||||||||||||||||||||||||||||||||||||||||||||||
| Total Plan Assets | $ | $ | $ | $ | $ | $ | $ | $ | |||||||||||||||||||||||||||||||||||||||
The pension benefits fixed income category includes $9.6 million and $8.9 million of money market fund investments as of December 31, 2020 and 2019, respectively. The other benefits fixed income category includes $3.1 million and $4.5 million of money market fund investments as of December 31, 2020 and 2019, respectively.
Assets measured at NAV include investments in commingled funds that are comprised of fixed income and equity securities. These commingled funds are not publicly traded, and therefore no publicly quoted market price is readily available. The values of the commingled funds are measured at estimated fair value, which is determined based on the unit value of the funds and have not been classified in the fair value hierarchy tables above. There are no restrictions on the terms and conditions upon which the investments may be redeemed.
75
CALIFORNIA WATER SERVICE GROUP
Notes to Consolidated Financial Statements (Continued)
December 31, 2020, 2019, and 2018
Dollar amounts in thousands unless otherwise stated
12 EMPLOYEE BENEFIT PLANS (Continued)
Changes in Plan Assets, Benefits Obligations, and Funded Status
The following table reconciles the funded status of the plans with the accrued pension liability and the net postretirement benefit liability as of December 31, 2020 and 2019:
| Pension Benefits | Other Benefits | ||||||||||||||||||||||
| 2020 | 2019 | 2020 | 2019 | ||||||||||||||||||||
| Change in projected benefit obligation: | |||||||||||||||||||||||
| Beginning of year | $ | $ | $ | $ | |||||||||||||||||||
| Service cost | |||||||||||||||||||||||
| Interest cost | |||||||||||||||||||||||
| Actuarial (gain) loss (1) | ( |
( |
|||||||||||||||||||||
| Plan amendment | ( |
||||||||||||||||||||||
| Benefits paid, net of retiree premiums | ( |
( |
( |
( |
|||||||||||||||||||
| End of year | $ | $ | $ | $ | |||||||||||||||||||
| Change in plan assets: | |||||||||||||||||||||||
| Fair value of plan assets at beginning of year | $ | $ | $ | $ | |||||||||||||||||||
| Actual return on plan assets | |||||||||||||||||||||||
| Employer contributions | |||||||||||||||||||||||
| Retiree contributions and Medicare part D subsidies | |||||||||||||||||||||||
| Benefits paid | ( |
( |
( |
( |
|||||||||||||||||||
| Other adjustments | |||||||||||||||||||||||
| Fair value of plan assets at end of year | $ | $ | $ | $ | |||||||||||||||||||
| Funded status (2) | $ | ( |
$ | ( |
$ | $ | ( |
||||||||||||||||
| Unrecognized actuarial loss | ( |
||||||||||||||||||||||
| Unrecognized prior service cost | |||||||||||||||||||||||
| Net amount recognized | $ | ( |
$ | ( |
$ | ( |
$ | ( |
|||||||||||||||
_______________________________________________________________________________
1.The actuarial gain for pension and other benefits in 2020 was due to a decrease in the cost of living adjustment, the use of an updated mortality assumption in determining the benefit obligation, and a reduction in anticipated health care trend (Other benefits only) partially offset by actuarial losses due to a lower discount rate and a higher rate of compensation increases (Pension benefits only) used in the calculation. The actuarial losses in 2019 for both pension and other benefits was due to a decrease in the discount rate used in determining the benefit obligation.
2.The short-term portion of the pension benefits was $2.1 million as of December 31, 2020 and December 31, 2019 and is recorded as part of other accrued liabilities on the Company's 2020 and 2019 Consolidated Balance Sheets.
76
CALIFORNIA WATER SERVICE GROUP
Notes to Consolidated Financial Statements (Continued)
December 31, 2020, 2019, and 2018
Dollar amounts in thousands unless otherwise stated
12 EMPLOYEE BENEFIT PLANS (Continued)
Amounts recognized on the balance sheet consist of:
| Pension Benefits | Other Benefits | ||||||||||||||||||||||
| 2020 | 2019 | 2020 | 2019 | ||||||||||||||||||||
| Noncurrent assets | $ | $ | $ | $ | |||||||||||||||||||
| Accrued benefit costs | ( |
( |
( |
||||||||||||||||||||
| Accrued benefit liability | ( |
( |
( |
||||||||||||||||||||
| Regulatory assets | |||||||||||||||||||||||
| Regulatory liabilities | ( |
||||||||||||||||||||||
| Net amount recognized | $ | ( |
$ | ( |
$ | ( |
$ | ( |
|||||||||||||||
Valuation Assumptions
Below are the actuarial assumptions used in determining the benefit obligation for the benefit plans:
| Pension Benefits | Other Benefits | ||||||||||||||||||||||
| 2020 | 2019 | 2020 | 2019 | ||||||||||||||||||||
| Weighted average assumptions as of December 31: | |||||||||||||||||||||||
| Discount rate - pension plan | % | % | % | % | |||||||||||||||||||
| Discount rate - SERP | % | % | |||||||||||||||||||||
| Long-term rate of return on plan assets | % | % | % | % | |||||||||||||||||||
| Rate of compensation increases - pension plan | % | % | |||||||||||||||||||||
| Rate of compensation increases - SERP | % | % | |||||||||||||||||||||
| Cost of living adjustment | % | % | |||||||||||||||||||||
For December 31, 2020 measurement purposes, the Company assumed a 5.5 % annual rate of increase for 2020 in the per capita cost of covered benefits with rate decreasing to 5.0 % by 2023, then gradually grading down to 3.8 % over the next 40 years.
In 2020, the Company changed both the yield curve used to develop the discount rate and the method used to estimate the service and interest cost components of net periodic pension cost. The new yield curve used a higher-yielding subset of bonds that the Company believes will better approximate the rate at which the obligations could be effectively settled, currently. The new method uses the spot rate approach to estimate the service and interest costs by applying the specific spot rates along the yield curve used to determine the benefit obligation to the relevant projected cash outflows. Previously, these cost components were determined using a single-weighted average discount rate. This change does not affect the measurement of the projected benefit obligation. The Company made this change to provide a more precise measurement of service and interest costs by improving the correlation between projected benefit cash flows to the corresponding spot rates. The Company has accounted for this change as a change in accounting estimate and accordingly has accounted for it prospectively.
The long-term rate of return assumption is the expected rate of return on a balanced portfolio invested roughly 60 % in equities and 40 % in fixed income securities. Returns on equity investments were estimated based on estimates of dividend yield and real earnings added to a 2.10 % long-term inflation rate. For the pension plans, the assumed returns were 8.18 % for domestic equities and 9.17 % for foreign equities. For the other benefits plan, the assumed returns was 7.86 % for domestic equities. Returns on fixed-income investments were projected based on investment maturities and credit spreads added to a 2.10 % long-term inflation rate. For the pension and other benefit plans, the assumed returns were 3.44 % for fixed income investments and 2.57 % for short-term cash investments. The average return for the pension and other benefit plans for the last 5 and 10 years was 11.90 % and 9.40 %, respectively. The Company is using a long-term rate of return of 6.50 % for the pension plan and 6.00 % for the other benefit plan, which is between the 25th and 75th percentile of expected results.
In 2020, the Company used the Society of Actuaries' Pri-2012 Total Dataset Mortality Tables for private-sector retirement plans in the United States and Mortality Improvement Scale (MP-2020) with adjustments to long-term improvements for measuring retirement plan obligations.
77
CALIFORNIA WATER SERVICE GROUP
Notes to Consolidated Financial Statements (Continued)
December 31, 2020, 2019, and 2018
Dollar amounts in thousands unless otherwise stated
12 EMPLOYEE BENEFIT PLANS (Continued)
Components of Net Periodic Benefit Cost
Net periodic benefit costs for the pension and other postretirement plans for the years ended December 31, 2020 and 2019, included the following components:
| Pension Plan | Other Benefits | ||||||||||||||||||||||||||||||||||
| 2020 | 2019 | 2018 | 2020 | 2019 | 2018 | ||||||||||||||||||||||||||||||
| Service cost | $ | $ | $ | $ | $ | $ | |||||||||||||||||||||||||||||
| Interest cost | |||||||||||||||||||||||||||||||||||
| Expected return on plan assets | ( |
( |
( |
( |
( |
( |
|||||||||||||||||||||||||||||
| Net amortization and deferral | |||||||||||||||||||||||||||||||||||
| Net periodic benefit cost | $ | $ | $ | $ | $ | $ | |||||||||||||||||||||||||||||
Service cost portion of the pension plan and other postretirement benefits is recognized in administrative and general within the Consolidated Statements of Income. Other components of net periodic benefit costs include interest costs, expected return on plan assets, amortization of prior service costs, and recognized net actuarial loss and are reported together as other components of net periodic benefit cost within the Consolidated Statements of Income.
Below are the actuarial assumptions used in determining the net periodic benefit costs for the benefit plans, which uses the end of the prior year as the measurement date:
| Pension Benefits | Other Benefits | ||||||||||||||||||||||
| 2020 | 2019 | 2020 | 2019 | ||||||||||||||||||||
| Weighted average assumptions as of December 31: | |||||||||||||||||||||||
| Discount rate | % | % | % | % | |||||||||||||||||||
| Long-term rate of return on plan assets | % | % | % | % | |||||||||||||||||||
| Rate of compensation increases - pension plan | % | % | |||||||||||||||||||||
| Rate of compensation increases - SERP | % | % | |||||||||||||||||||||
| Cost of living adjustment | % | % | |||||||||||||||||||||
The health care cost trend rate assumption has a significant effect on the amounts reported. For 2020 measurement purposes, the Company assumed a 5.5 % annual rate of increase in the per capita cost of covered benefits with the rate decreasing to 5.0 % by 2023, then gradually grading down to 4.0 % over the next 53 years.
The Company intends to make annual contributions that meet the funding requirements of ERISA. The Company estimates in 2021 that the annual contribution to the pension plans will be $23.5 million and the annual contribution to the other postretirement plan will be $2.2 million.
78
CALIFORNIA WATER SERVICE GROUP
Notes to Consolidated Financial Statements (Continued)
December 31, 2020, 2019, and 2018
Dollar amounts in thousands unless otherwise stated
13 STOCK-BASED COMPENSATION PLANS
The Company's equity incentive plan was approved and amended by stockholders on April 27, 2005 and May 20, 2014. The Company is authorized to issue awards up to 2,000,000 shares of common stock.
During 2020, the Company granted RSAs of common stock to Officers and to the Board of Directors. An RSA share represents the right to receive a share of the Company's common stock and is valued based on the fair market value of the Company's common stock at the date of grant. RSAs granted to Officers vest over 36 months with the first year cliff vesting. In general, RSAs granted to Board of Directors vest at the end of 12 months. The RSAs are recognized as expense evenly over 36 months for the shares granted to Officers and 12 months for the shares granted to Board of Directors. As of December 31, 2020, there was approximately $1.5 million of total unrecognized compensation cost related to RSAs. The cost is expected to be recognized over a weighted average period of 1.61 years.
A summary of the status of the outstanding RSAs as of December 31, 2020 is presented below:
| Number of RSA Shares | Weighted-Average Grant-Date Fair Value | ||||||||||
| RSAs at January 1, 2020 | $ | ||||||||||
| Granted | |||||||||||
| Vested | ( |
||||||||||
| RSAs at December 31, 2020 | $ | ||||||||||
During 2020, the Company granted performance-based RSUs of common stock to Officers. Each award reflects a target number shares of common stock that may be issued to the award recipient. The 2020 awards may be earned upon the completion of a 3-year performance period. Whether RSUs are earned at the end of the performance period will be determined based on the achievement of certain performance objectives set by the Board of Directors Compensation Committee in connection with the issuance of the RSUs. The performance objectives are based on the Company's business plan covering the performance period. The performance objectives include achieving the budgeted return on equity, budgeted investment in utility plant, customer service standards, employee safety standards and water quality standards. Depending on the results achieved during the 3-year performance period, the actual number of shares that a grant recipient receives at the end of the performance period may range from 0 % to 200 % of the target shares granted, provided that the grantee is continuously employed by the Company through the vesting date. If prior to the vesting date employment is terminated by reason of death, disability or normal retirement, then a pro rata portion of this award will vest. RSUs are not included in diluted shares until earned. The RSUs are recognized as expense ratably over the 3-year performance period using a fair market value of the Company's common share at the date of grant and an estimated number of RSUs earned during the performance period. As of December 31, 2020, there was approximately $1.8 million of total unrecognized compensation cost related to RSUs. The cost is expected to be recognized over a weighted average period of 1.21 years.
A summary of the status of the outstanding RSUs as of December 31, 2020 is presented below:
| Number of RSA Shares | Weighted-Average Grant-Date Fair Value | ||||||||||
| RSUs at January 1, 2020 | $ | ||||||||||
| Granted | |||||||||||
| Performance criteria adjustment | |||||||||||
| Vested | ( |
||||||||||
| Forfeited | ( |
||||||||||
| RSUs at December 31, 2020 | $ | ||||||||||
The Company has recorded compensation costs for the RSAs and RSUs which are included in administrative and general operating expenses in the amount of $4.4 million for 2020 and $6.5 million for 2019.
79
CALIFORNIA WATER SERVICE GROUP
Notes to Consolidated Financial Statements (Continued)
December 31, 2020, 2019, and 2018
Dollar amounts in thousands unless otherwise stated
14 FAIR VALUE OF FINANCIAL INSTRUMENTS
The accounting guidance for fair value measurements and disclosures provides a single definition of fair value and requires certain disclosures about assets and liabilities measured at fair value. A hierarchical framework for disclosing the observability of the inputs utilized in measuring assets and liabilities at fair value is established by this guidance. The three levels in the hierarchy are described in Note 12 - Employee Benefit Plans.
Specific valuation methods include the following:
Cash, Accounts receivable, and accounts payable carrying amounts approximated the fair value because of the short-term maturity of the instruments.
Long-term debt fair values were estimated using the published quoted market price, if available, or the discounted cash flow analysis, based on the current rates available using a risk-free rate (a U.S. Treasury securities yield curve) plus a risk premium of 1.83 %.
| December 31, 2020 | |||||||||||||||||||||||||||||
| Fair Value | |||||||||||||||||||||||||||||
| Cost | Level 1 | Level 2 | Level 3 | Total | |||||||||||||||||||||||||
| Long-term debt, including current maturities, net | $ | $ | $ | $ | $ | ||||||||||||||||||||||||
| December 31, 2019 | |||||||||||||||||||||||||||||
| Fair Value | |||||||||||||||||||||||||||||
| Cost | Level 1 | Level 2 | Level 3 | Total | |||||||||||||||||||||||||
| Long-term debt, including current maturities, net | $ | $ | $ | $ | $ | ||||||||||||||||||||||||
15 COMMITMENTS AND CONTINGENCIES
Commitments
Water Supply Contracts
The Company has long-term commitments to purchase water from water wholesalers. The commitments are noted in the table below.
| Water Supply Contracts* |
|||||
| 2021 | $ | ||||
| 2022 | |||||
| 2023 | |||||
| 2024 | |||||
| 2025 | |||||
| Thereafter | |||||
_______________________________________________________________________________
* Estimated annual contractual obligations are based on the same payment levels as 2020.
Water Supply Contracts
The Company has a long-term contract with the Santa Clara Valley Water District that requires the Company to purchase minimum annual water quantities. Purchases are priced at the districts then-current wholesale water rate. The Company operates to purchase sufficient water to equal or exceed the minimum quantities under the contract. The total paid to Santa Clara Valley Water District was $15.2 million in 2020, $13.6 million in 2019, and $9.7 million in 2018.
80
CALIFORNIA WATER SERVICE GROUP
Notes to Consolidated Financial Statements (Continued)
December 31, 2020, 2019, and 2018
Dollar amounts in thousands unless otherwise stated
15 COMMITMENTS AND CONTINGENCIES (Continued)
The Company also has a water supply contract with Stockton East Water District (SEWD) that requires a fixed monthly payment. Each year, the fixed monthly payment is adjusted for changes to SEWD's costs. The total paid under the contract was $14.3 million in 2020, $13.3 million in 2019, and $13.7 million in 2018.
On September 21, 2005, the Company entered into an agreement with Kern County Water Agency (Agency) to obtain treated water for the Company's operations. The term of the agreement is to January 1, 2035, or until the repayment of the Agency's bonds (described hereafter) occurs. Under the terms of the agreement, the Company is obligated to purchase approximately 20,500 acre feet of treated water per year. The Company is obligated to pay the Capital Facilities Charge and the Treated Water Charge regardless of whether it can use the water in its operation, and is obligated for these charges even if the Agency cannot produce an adequate amount to supply the 20,500 acre feet in the year. This agreement supersedes a prior agreement with Kern County Water Agency for the supply of 11,500 acre feet of water per year.
If any of the parties were to default on making payments of the Capital Facilities Charge, then the other parties are obligated to pay for the defaulting party's share on a pro-rata basis. If there is a payment default by a party and the remaining parties have to make payments, they are also entitled to a pro-rata share of the defaulting party's water allocation.
The Company expects to use all its entitled water in its operations every year. In addition, if the Company were to pay for and receive additional amounts of water due to a default of another participating party; the Company believes it could use this additional water in its operations without incurring substantial incremental cost increases. If additional treated water is available, all parties have an option to purchase this additional treated water, subject to the Agency's right to allocate the water among the parties.
The total obligation of all parties, excluding the Company, is approximately $82.4 million to the Agency. Based on the credit worthiness of the other participants, which are government entities, it is believed to be highly unlikely that the Company would be required to assume any other parties' obligations under the contract due to their default.
The Company pays a capital facilities charge and charges related to treated water that together total $9.8 million annually, which equates to $476.83 dollars per acre foot. Total treated water charge for 2020 was $3.7 million. As treated water is being delivered, the Company will also be obligated for the Company's portion of the operating costs; that portion is currently estimated to be $55.8 dollars per acre foot. The actual amount will vary due to variations from estimates, inflation, and other changes in the cost structure. Our overall estimated cost of $476.83 dollars per acre foot is less than the estimated cost of procuring untreated water (assuming water rights could be obtained) and then providing treatment.
Leases
The Company has operating and finance leases for water systems, offices, land easements, licenses, equipment, and other facilities. The leases generally have remaining lease terms of 1 50 25
The Company determines if an arrangement is a lease at contract inception. Generally, a lease agreement exists if the Company determines that the arrangement gives the Company control over the use of an identified asset and obtains substantially all of the benefits from the identified asset.
81
CALIFORNIA WATER SERVICE GROUP
Notes to Consolidated Financial Statements (Continued)
December 31, 2020, 2019, and 2018
Dollar amounts in thousands unless otherwise stated
15 COMMITMENTS AND CONTINGENCIES (Continued)
The right-of-use (ROU) assets that are recorded represent the Company’s right to use an underlying asset for the lease term and lease liabilities represent the Company’s obligation to make lease payments arising from the lease. Lease ROU assets and liabilities are recognized at commencement date based on the present value of lease payments over the lease term. As most of the Company’s operating leases do not provide an implicit rate, the Company uses an incremental borrowing rate based on the information available at commencement date in determining the present value of lease payments. The ROU asset and lease liability may include options to extend or terminate the lease when it is reasonably certain that the Company will exercise that option. Variable lease payments that are based on changes in CPI are included in the measurement of ROU asset and lease liability on the basis of the rate at lease commencement. Subsequent changes to the payments as a result of changes to the CPI rate are recognized in the period in which the obligation of these payments is incurred.
Supplemental balance sheet information related to leases was as follows:
| As of December 31, 2020 | As of December 31, 2019 | ||||||||||
| Operating leases | |||||||||||
| Other assets: Other | $ | $ | |||||||||
| Other accrued liabilities | $ | $ | |||||||||
| Total operating lease liabilities | $ | $ | |||||||||
| Finance leases | |||||||||||
| Depreciable plant and equipment | $ | $ | |||||||||
| Accumulated depreciation and amortization | ( |
( |
|||||||||
| Net utility plant | $ | $ | |||||||||
| Current maturities of long-term debt, net | $ | $ | |||||||||
| Long-term debt, net | |||||||||||
| Total finance lease liabilities | $ | $ | |||||||||
| Weighted average remaining lease term | |||||||||||
| Operating leases | |||||||||||
| Finance leases | |||||||||||
| Weighted average discount rate | |||||||||||
| Operating leases | % | % | |||||||||
| Finance leases | % | % | |||||||||
82
CALIFORNIA WATER SERVICE GROUP
Notes to Consolidated Financial Statements (Continued)
December 31, 2020, 2019, and 2018
Dollar amounts in thousands unless otherwise stated
15 COMMITMENTS AND CONTINGENCIES (Continued)
The components of lease expense were as follows:
| 2020 | 2019 | ||||||||||
| Operating lease cost | $ | $ | |||||||||
| Finance lease cost: | |||||||||||
| Amortization of right-of-use assets | $ | $ | |||||||||
| Interest on lease liabilities | |||||||||||
| Total finance lease cost | $ | $ | |||||||||
| Short-term lease cost | $ | $ | |||||||||
| Variable lease cost | |||||||||||
| Total lease cost | $ |
|
$ |
|
|||||||
Rent expense under the previous lease accounting standard for operating leases was $2.0 million in 2018.
Supplemental cash flow information related to leases was as follows:
| 2020 | 2019 | ||||||||||
| Cash paid for amounts included in the measurement of lease liabilities: | |||||||||||
| Operating cash flows from operating leases | $ | $ | |||||||||
| Operating cash flows from finance leases | |||||||||||
| Financing cash flows from finance leases | |||||||||||
| Non-cash activities: right-of-use assets obtained in exchange for lease obligations: | |||||||||||
| Operating leases | |||||||||||
| Finance leases | |||||||||||
Maturities of lease liabilities as of December 31, 2020 are as follows:
| Year Ending December 31, | Operating Leases | Finance Leases | |||||||||
| 2021 | $ | $ | |||||||||
| 2022 | |||||||||||
| 2023 | |||||||||||
| 2024 | |||||||||||
| 2025 | |||||||||||
| Thereafter | |||||||||||
| Total lease payments | $ | $ | |||||||||
| Less imputed interest | $ | ( |
$ | ( |
|||||||
| Total | $ |
|
$ |
|
|||||||
83
CALIFORNIA WATER SERVICE GROUP
Notes to Consolidated Financial Statements (Continued)
December 31, 2020, 2019, and 2018
Dollar amounts in thousands unless otherwise stated
15 COMMITMENTS AND CONTINGENCIES (Continued)
Contingencies
Groundwater Contamination
The Company has undertaken litigation against third parties to recover past and future costs related to ground water contamination in our service areas. The cost of litigation is expensed as incurred and any settlement is first offset against such costs. The CPUC's general policy requires all proceeds from contamination litigation to be used first to pay transactional expenses, then to make customers whole for water treatment costs to comply with the CPUC's water quality standards. The CPUC allows for a risk-based consideration of contamination proceeds which exceed the costs of the remediation described above and may result in some sharing of proceeds with the shareholder, determined on a case by case basis. The CPUC has authorized various memorandum accounts that allow the Company to track significant litigation costs to request recovery of these costs in future filings and uses of proceeds to comply with CPUC's general policy.
As previously reported, Cal Water has filed with the City of Bakersfield, in the Superior Court of California, a lawsuit that names potentially PRPs, who manufactured and distributed products containing TCP in California. TCP has been detected in the ground water. The lawsuit seeks to recover treatment costs necessary to remove TCP. On December 20, 2017, Cal Water entered into an $85.0 million settlement agreement and release of claims with the PRPs, in California Water Service Company and City of Bakersfield v. The Dow Chemical Company, et al., Civil Case No. CIV-470999 (TCP Action). The TCP Action seeks damages and other relief related to the PRPs’ alleged contamination of drinking water supply and water wells with the chemical TCP. The proceeds from the settlement, after payment of the legal fees, was $56.0 million and will be used to reimburse a portion of the capital costs associated with Cal Water’s remediation efforts related to such alleged TCP contamination. As of December 31, 2020, Cal Water has used $46.7 million of the proceeds on remediation efforts related to the alleged TCP contamination. Under the terms of the Agreement, the PRPs are released from all claims regarding 47 of the 57 total claimed wells, and Cal Water agrees to file a dismissal with prejudice of the TCP Action. The PRPs are also released from future claims regarding TCP contamination of any other wells, unless and until Cal Water has installed granular activated carbon filtration systems or other then-approved Sate treatment technology for TCP on, or replaced, 36 wells due to TCP contamination. As of December 31, 2020, Cal Water believes the proceeds are non-taxable based upon its intent to reinvest them in qualifying assets.
Other Legal Matters
From time to time, the Company is involved in various disputes and litigation matters that arise in the ordinary course of business. The status of each significant matter is reviewed and assessed for potential financial exposure. If the potential loss from any claim or legal proceeding is considered probable and the amount of the range of loss can be estimated, a liability is accrued for the estimated loss in accordance with the accounting standards for contingencies. Legal proceedings are subject to uncertainties, and the outcomes are difficult to predict. Because of such uncertainties, accruals are based on the best information available at the time. While the outcome of these disputes and litigation matters cannot be predicted with any certainty, management does not believe when taking into account existing reserves the ultimate resolution of these matters will materially affect the Company's financial position, results of operations, or cash flows. The Company has recognized a liability of $2.6 million for all known legal matters as of December 31, 2020 primarily due to potable water main leaks and other work related legal matters. The cost of litigation is expensed as incurred and any settlement is first offset against such costs. Any settlement in excess of the cost to litigate is accounted for on a case by case basis, dependent on the nature of the settlement.
16 Acquisitions
Rainier View Water Company
On March 27, 2020, the Company’s wholly owned subsidiary, Washington Water, received regulatory approval from the WUTC for Washington Water's application for the sale and transfer of assets of Rainier View Water Company. Washington Water paid $37.6 million in cash to take control of the water system on June 1, 2020. The acquisition of Rainier View Water doubles the size of Washington Water’s operations and solidifies the Company’s position as the largest investor-owned water company in the state of Washington, regulated by the WUTC. Rainier View Water serves approximately 35,000 people in parts of Graham, Spanaway, Puyallup, Gig Harbor, and other nearby areas through approximately 18,500 customer connections in 27 water systems.
84
CALIFORNIA WATER SERVICE GROUP
Notes to Consolidated Financial Statements (Continued)
December 31, 2020, 2019, and 2018
Dollar amounts in thousands unless otherwise stated
16 Acquisitions (Continued)
Assets acquired were $32.6 million, including utility plant of $31.1 million, and liabilities of $23.5 million were assumed, including $21.3 million of contributions in aid of construction. Goodwill of $28.5 million was recorded and consists largely of the synergies expected from combining the operations of Rainier View Water Company and Washington Water.
The Company expects all the goodwill from the acquisition to be deductible for tax purposes.
Condensed balance sheets and pro forma results of operations for this acquisition have not been presented since the impact of the acquisition was not material.
Kalaeloa Water Company
On September 25, 2020, the Hawaii Public Utilities Commission (HPUC) approved Hawaii Water's application for the purchase of the Membership Interests of Hunt in Kalaeloa Water Company, LLC. Hawaii Water paid $3.1 million in cash to control of the water system on November 1, 2020. Kalaeloa Water Company is located in the growing Kapolei area of the City and County of Honolulu on Oahu, serves residential, commercial, and industrial customers in Kalaeloa, a 3,700 -acre area located on the former Barbers Point Naval Air Station. Hawaii Water will continue to invest in local system infrastructure to keep service reliable for customers’ every day and emergency needs, and work to provide customers with continued access to safe, high-quality water and excellent customer service.
Assets acquired were $2.8 million, including utility plant of $2.1 million, and liabilities of $0.4 million were assumed. Goodwill of $0.7 million was recorded and consists largely of the synergies expected from combining the operations of Kalealoa Water Company and Hawaii Water.
The Company expects all the goodwill from the acquisition to be deductible for tax purposes.
Condensed balance sheets and pro forma results of operations for this acquisition have not been presented since the impact of the acquisition was not material.
Item 9. Changes in and Disagreements with Accountants on Accounting and Financial Disclosure.
None
85
Item 9A. Controls and Procedures.
Management's Evaluation of Disclosure Controls and Procedures
We maintain disclosure controls and procedures (as defined in Rules 13a-15(e) and 15d-15(e) under the Securities Exchange Act of 1934, as amended) that are designed to ensure that information required to be disclosed in our reports filed or submitted under the Securities Exchange Act of 1934, as amended, is recorded, processed, summarized and reported, within the time periods specified in the Securities and Exchange Commission's rules and forms, and that such information is accumulated and communicated to our management, including our Chief Executive Officer and Chief Financial Officer, as appropriate, to allow for timely decisions regarding required disclosure.
In designing and evaluating the disclosure controls and procedures, management, including the Chief Executive Officer and Chief Financial Officer, recognized that any controls and procedures, no matter how well designed and operated, can provide only reasonable assurance of achieving the desired control objectives, and management is required to apply its judgment in evaluating the cost-benefit relationship of possible controls and procedures. Accordingly, our disclosure controls and procedures have been designed to provide reasonable assurance of achieving their objectives.
Our management, with the participation of our Chief Executive Officer and our Chief Financial Officer, evaluated the effectiveness of our disclosure controls and procedures as of December 31, 2020. Based on that evaluation, we concluded that our disclosure controls and procedures were effective at the reasonable assurance level.
There was no change in our internal control over financial reporting during the quarter ended December 31, 2020, that has materially affected, or is reasonably likely to materially affect, our internal control over financial reporting.
Management's Annual Report on Internal Control over Financial Reporting
Management is responsible for establishing and maintaining adequate internal control over financial reporting (as defined in Rule 13a-15(f) and 15d-15(f) under the Securities Exchange Act of 1934, as amended). Management assessed the effectiveness of our internal control over financial reporting as of December 31, 2020. In making this assessment, management used the criteria set forth by the Committee of Sponsoring Organizations of the Treadway Commission in "Internal Control—Integrated Framework (2013)". Management has concluded that, as of December 31, 2020 our internal control over financial reporting is effective based on these criteria. Our independent registered public accounting firm, Deloitte & Touche LLP, has audited the effectiveness of our internal control over financial reporting as of December 31, 2020, as stated in their report, which is included in Item 8 and incorporated herein.
Item 9B. Other Information.
None.
PART III
Item 10. Directors and Executive Officers and Corporate Governance.
The information required by this Item as to directors of the Company and the Company's Audit Committee is contained in the sections captioned "Board Structure," "Proposal No. 1—Election of Directors" and, as applicable, "Delinquent Section 16(a) Reports" of the definitive Proxy Statement for our Annual Meeting of Stockholders to be held on or about May 26, 2021 (the "2021 Proxy Statement"), and is incorporated herein by reference.
Information required by this Item regarding executive officers is included in a separate section captioned "Information About Our Executive Officers" contained in Part I of this annual report.
We have adopted a code of ethics that applies to all of our directors, officers, and employees, including our principal executive, financial and accounting officers, or persons performing similar functions. Our Code of Ethics is posted on our corporate governance website located at http://www.calwatergroup.com. In addition, amendments to the Code of Ethics and any grant of a waiver from a provision of the Code of Ethics requiring disclosure under applicable SEC and NYSE rules will be disclosed at the same location as the Code of Ethics on our corporate governance website located at http://www.calwatergroup.com within four business days of such amendment or waiver.
Item 11. Executive Compensation.
The information required by this Item is contained under the captions "Compensation Discussion and Analysis," "Report of the Organization and Compensation Committee of the Board of Directors on Executive Compensation," and "Organization and Compensation Committee Interlocks and Insider Participation" of the 2021 Proxy Statement and is incorporated herein by reference.
86
Item 12. Security Ownership of Certain Beneficial Owners and Management and Related Stockholder Matters.
The information required by this Item regarding security ownership of certain beneficial owners and management is contained in the section captioned "Stock Ownership of Management and Certain Beneficial Owners" of the 2021 Proxy Statement and is incorporated herein by reference.
The following table represents securities authorized to be issued under our equity compensation plan:
| Plan Category | Number of Securities to be Issued Upon Exercise of Outstanding Rights (a) |
Weighted-Average Exercise Price of Outstanding Rights |
Number of Securities Remaining Available for Future Issuance Under Equity Compensation Plan (Excluding Securities Reflected in Column) (a) |
||||||||||||||
| Equity compensation plans approved by security holders | 87,787 | $ | 46.62 | 1,965,335 | |||||||||||||
| Equity compensation plans not approved by security holders | — | — | — | ||||||||||||||
| Total | 87,787 | $ | 46.62 | 1,965,335 | |||||||||||||
Item 13. Certain Relationships and Related Transactions and Director Independence.
The information required by this Item is contained in the sections captioned "Certain Related Persons Transactions" and "Board Structure" of the 2021 Proxy Statement and is incorporated herein by reference.
Item 14. Principal Accountant Fees and Services.
The information required by this Item is contained in the section captioned "Report of the Audit Committee" and "Relationship with the Independent Registered Public Accounting Firm" of the 2021 Proxy Statement and is incorporated herein by reference.
PART IV
Item 15. Exhibits, Financial Statement Schedules.
(a)As part of this Form 10-K, the following documents are being filed:
1.Financial Statement: See "Index to Consolidated Financial Statements" in Part II, Item 8 of this Form 10-K.
2.Financial Statement Schedules: No financial statement schedules are being included since the information otherwise required is included in the financial statements and the notes thereto.
3.Exhibits: The exhibits listed in the accompanying index to exhibits are filed or incorporated by reference.
EXHIBIT INDEX
Unless filed with this Form 10-K, the documents listed are incorporated by reference to the filings referred to:
| Exhibit Number | ||||||||
| 1.1 | ||||||||
| 3.1 | ||||||||
| 3.2 | ||||||||
| 3.3 | ||||||||
| 4.1 | ||||||||
87
| Exhibit Number | ||||||||
| 4.2 | ||||||||
| 4.3 | ||||||||
| 4.4 | ||||||||
| 4.5 | ||||||||
| 4.6 | ||||||||
| 4.7 | ||||||||
| 4.8 | ||||||||
| 4.9 | ||||||||
| 4.10 | ||||||||
| 4.11 | ||||||||
| 4.12 | ||||||||
| 4.13 | ||||||||
| 4.14 | ||||||||
| 4.15 | The Company agrees to furnish upon request to the Securities and Exchange Commission a copy of each instrument defining the rights of holders of long-term debt of the Company. | |||||||
| 4.16 | ||||||||
| 10.1 | Water Supply Contract between Cal Water and County of Butte relating to Cal Water's Oroville District; Water Supply Contract between Cal Water and the Kern County Water Agency relating to Cal Water's Bakersfield District; Water Supply Contract between Cal Water and Stockton East Water District relating to Cal Water's Stockton District. (Exhibits 5(g), 5(h), 5(i), 5(j), Registration Statement No. 2-53678, which exhibits are incorporated by reference to Annual Report on Form 10-K for the year ended December 31, 1974) | |||||||
| 10.2 | ||||||||
| 10.3 | ||||||||
88
| Exhibit Number | ||||||||
| 10.4 | Water Supply Contract dated January 27, 1981, between Cal Water and the Santa Clara Valley Water District relating to Cal Water's Los Altos District (Exhibit 10.3 to Annual Report on Form 10-K for the year ended December 31, 1992) | |||||||
| 10.5 | Amendments No. 3, 6 and 7 and Amendment dated June 17, 1980, to Water Supply Contract between Cal Water and the County of Butte relating to Cal Water's Oroville District. (Exhibit 10.5 to Annual Report on Form 10-K for the year ended December 31, 1992) | |||||||
| 10.6 | Amendment dated May 31, 1977, to Water Supply Contract between Cal Water and Stockton East Water District relating to Cal Water's Stockton District. (Exhibit 10.6 to Annual Report on Form 10-K for the year ended December 31, 1992) | |||||||
| 10.7 | Second Amended Contract dated September 25, 1987, among Stockton East Water District, California Water Service Company, the City of Stockton, the Lincoln Village Maintenance District, and the Colonial Heights Maintenance District Providing for the Sale of Treated Water. (Exhibit 10.7 to Annual Report on Form 10-K for the year ended December 31, 1987) | |||||||
| 10.8 | Water Supply Contract dated April 19, 1927, and Supplemental Agreement dated June 5, 1953, between Cal Water and Pacific Gas and Electric Company relating to Cal Water's Oroville District. (Exhibit 10.9 to Annual Report on Form 10-K for the year ended December 31, 1992) | |||||||
| 10.9 | Water Supply Agreement dated September 25, 1996, between the City of Bakersfield and California Water Service Company. (Exhibit 10.18 to Quarterly Report on Form 10-Q for the quarter ended September 30, 1996) | |||||||
| 10.10 | Water Supply Contract dated November 16, 1994, between California Water Service Company and Alameda County Flood Control and Water Conservation District relating to Cal Water's Livermore District (Exhibit 10.15 to Annual Report on Form 10-K for the year ended December 31, 1994) | |||||||
| 10.11 | ||||||||
| 10.12 | ||||||||
| 10.13 | ||||||||
| 10.14 | ||||||||
| 10.15 | ||||||||
| 10.16 | ||||||||
| 10.17 | ||||||||
| 10.18 | ||||||||
| 10.19 | ||||||||
| 10.20 | ||||||||
| 10.21 | ||||||||
| 10.22 | ||||||||
| 10.23 | ||||||||
89
| Exhibit Number | ||||||||
| 10.24 | ||||||||
| 10.25 | ||||||||
| 10.26 | ||||||||
| 21.0 | ||||||||
| 22.1 | ||||||||
| 23.1 | ||||||||
| 31.1 | ||||||||
| 31.2 | ||||||||
| 32.0 | ||||||||
| 101 | The following materials from this Annual Report on Form 10-K formatted in iXBRL (Inline eXtensible Business Reporting Language): (i) Consolidated Balance Sheets, (ii) Consolidated Statements of Income, (iii) Consolidated Statements of Cash Flows, (iv) Consolidated Statements of Common Stockholders' Equity and (v) the Notes to the Consolidated Financial Statements. | |||||||
| 104 | The cover page from this Annual Report on Form 10-K, formatted in iXBRL (included as exhibit 101). | |||||||
_______________________________________________________________________________
* Management contract or compensatory plan or arrangement.
Item 16. Form 10-K Summary.
None.
SIGNATURES
Pursuant to the requirements of Section 13 or 15(d) of the Securities Exchange Act of 1934, the registrant has duly caused this report to be signed on its behalf by the undersigned, thereunto duly authorized
| CALIFORNIA WATER SERVICE GROUP | ||||||||
| By | /s/ MARTIN A. KROPELNICKI | |||||||
|
MARTIN A. KROPELNICKI,
President and Chief Executive Officer
|
||||||||
| Date: February 25, 2021 | ||||||||
90
Pursuant to the requirements of the Securities Exchange Act of 1934, this report has been signed below by the following persons on behalf of the registrant and in the capacities and on the dates indicated.
| /s/ PETER C. NELSON | Chairman, Board of Directors | Date: February 25, 2021 | ||||||
| PETER C. NELSON | ||||||||
| /s/ GREGORY E. ALIFF | Member, Board of Directors | Date: February 25, 2021 | ||||||
| GREGORY E. ALIFF | ||||||||
| /s/ TERRY P. BAYER | Member, Board of Directors | Date: February 25, 2021 | ||||||
| TERRY P. BAYER | ||||||||
| /s/ SHELLY M. ESQUE | Member, Board of Directors | Date: February 25, 2021 | ||||||
| SHELLY M. ESQUE | ||||||||
| /s/ THOMAS M. KRUMMEL | Member, Board of Directors | Date: February 25, 2021 | ||||||
| THOMAS M. KRUMMEL, M.D. | ||||||||
| /s/ RICHARD P. MAGNUSON | Member, Board of Directors | Date: February 25, 2021 | ||||||
| RICHARD P. MAGNUSON | ||||||||
| /s/ SCOTT L. MORRIS | Member, Board of Directors | Date: February 25, 2021 | ||||||
| SCOTT L. MORRIS | ||||||||
| /s/ CAROL M. POTTENGER | Member, Board of Directors | Date: February 25, 2021 | ||||||
| CAROL M. POTTENGER | ||||||||
| /s/ LESTER A. SNOW | Member, Board of Directors | Date: February 25, 2021 | ||||||
| LESTER A. SNOW | ||||||||
| /s/ PATRICIA K. WAGNER | Member, Board of Directors | Date: February 25, 2021 | ||||||
| PATRICIA K. WAGNER | ||||||||
| /s/ MARTIN A. KROPELNICKI | President and Chief Executive Officer; Principal Executive Officer; Member, Board of Directors | Date: February 25, 2021 | ||||||
| MARTIN A. KROPELNICKI | ||||||||
| /s/ THOMAS F. SMEGAL III | Vice President, Chief Financial Officer and Treasurer; Principal Financial Officer | Date: February 25, 2021 | ||||||
| THOMAS F. SMEGAL III | ||||||||
| /s/ DAVID B. HEALEY | Vice President, Corporate Controller and Assistant Treasurer; Principal Accounting Officer | Date: February 25, 2021 | ||||||
| DAVID B. HEALEY | ||||||||
91