DEFA14A: Additional definitive proxy soliciting materials and Rule 14(a)(12) material
Published on April 17, 2026
UNITED STATES
SECURITIES AND EXCHANGE COMMISSION
Washington, D.C. 20549
SCHEDULE 14A
Proxy Statement Pursuant to Section 14(a) of
the Securities Exchange Act of 1934 (Amendment No. )
Filed by the Registrant x
Filed by a Party other than the Registrant ¨
Check the appropriate box:
| ¨ | Preliminary Proxy Statement |
| ¨ | Confidential, for Use of the Commission Only (as permitted by Rule 14a-6(e)(2)) |
| ¨ | Definitive Proxy Statement |
| x | Definitive Additional Materials |
| ¨ | Soliciting Material under §240.14a-12 |
California Water Service Group
(Name of Registrant as Specified In Its Charter)
(Name of Person(s) Filing Proxy Statement, if other than the Registrant)
Payment of Filing Fee (Check the appropriate box):
| x | No fee required |
| ¨ | Fee paid previously with preliminary materials |
| ¨ | Fee computed on table in exhibit required by Item 25(b) per Exchange Act Rules 14a-6(i)(1) and 0-11 |
California Water Service Group 2026 Annual Meeting, Stockholder Outreach
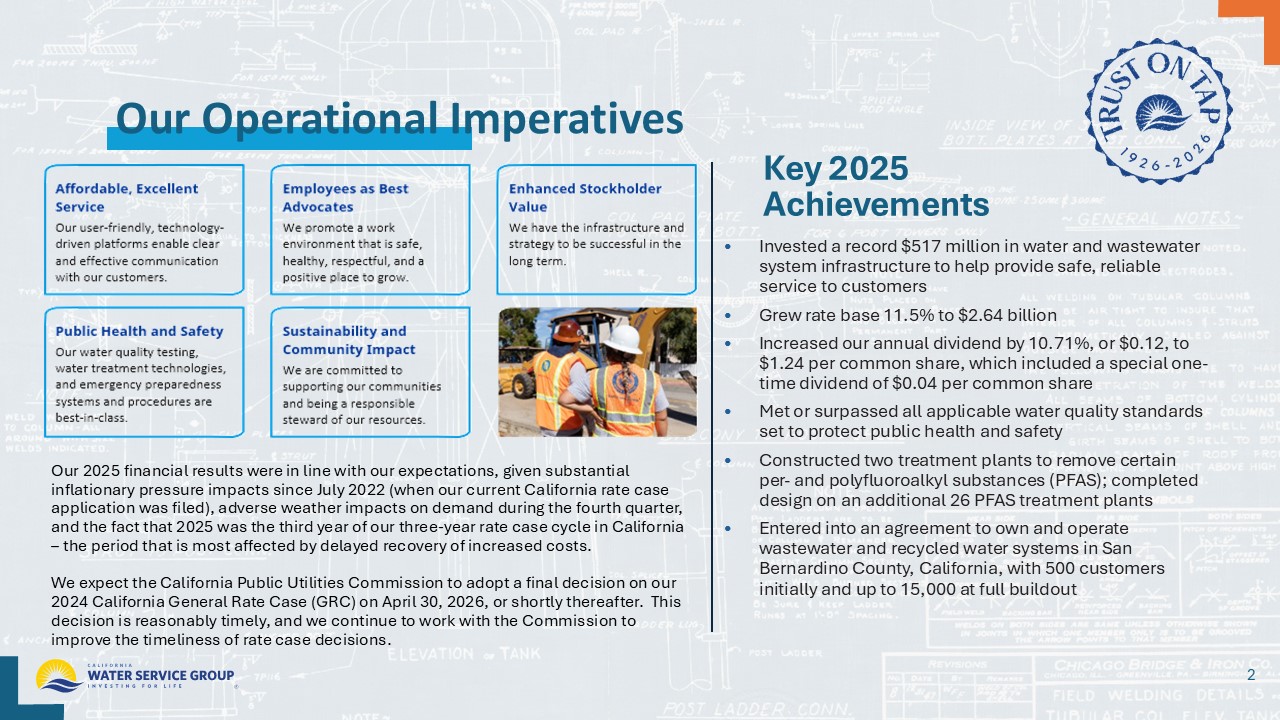
2 Our 2025 financial results were in line with our expectations, given substantial inflationary pressure impacts since July 2022 (when our current California rate case application was filed), adverse weather impacts on demand during the fourth quarter, and the fact that 2025 was the third year of our three - year rate case cycle in California – the period that is most affected by delayed recovery of increased costs. We expect the California Public Utilities Commission to adopt a final decision on our 2024 California General Rate Case (GRC) on April 30, 2026, or shortly thereafter . This decision is reasonably timely, and we continue to work with the Commission to improve the timeliness of rate case decisions. Our Operational Imperatives Key 2025 Achievements • Invested a record $517 million in water and wastewater system infrastructure to help provide safe, reliable service to customers • Grew rate base 11.5% to $2.64 billion • I ncreased our annual dividend by 10.71%, or $0.12, to $1.24 per common share, which include d a special one - time dividend of $0.04 per common share • Met or surpassed all applicable water quality standards set to protect public health and safety • Constructed two treatment plants to remove certain per - and polyfluoroalkyl substances (PFAS); completed design on an additional 26 PFAS treatment plants • E ntered into an agreement to own and operate wastewater and recycled water systems in San Bernardino County, California, with 500 customers initially and up to 15,000 at full buildout
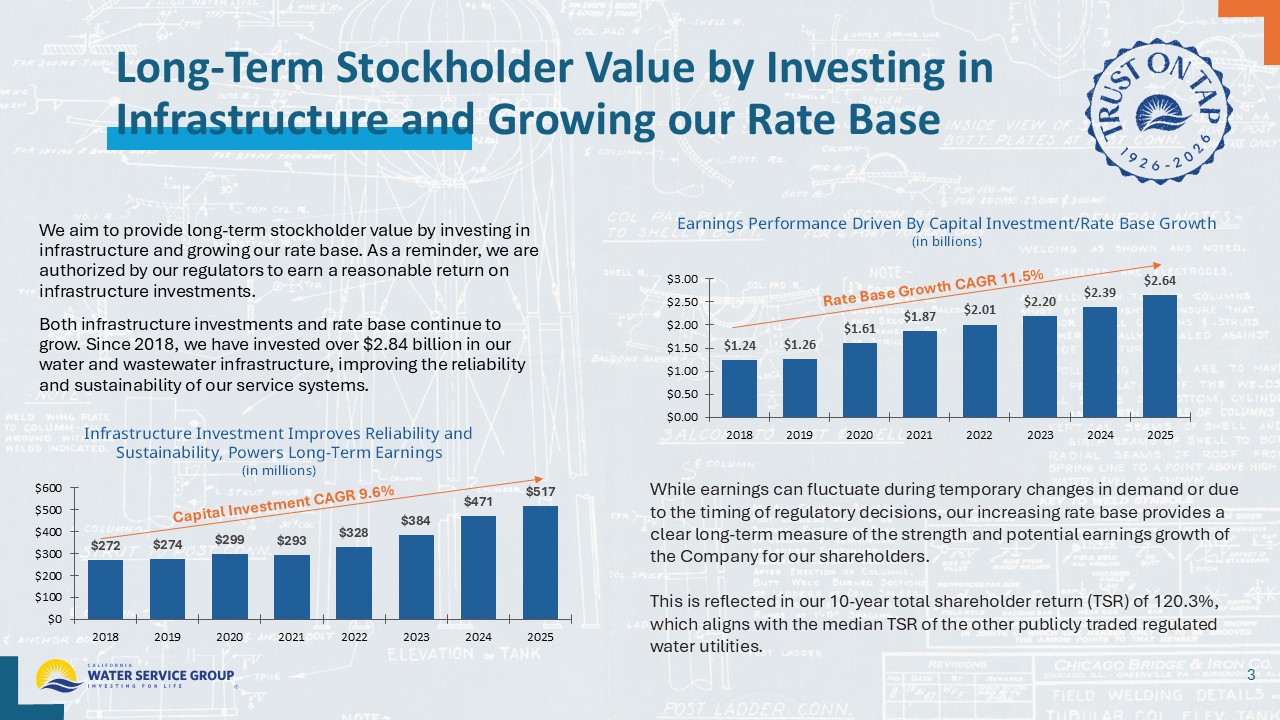
Long - Term Stockholder Value by Investing in Infrastructure and Growing our Rate Base We aim to provide long - term stockholder value by investing in infrastructure and growing our rate base. As a reminder, we are authorized by our regulators to earn a reasonable return on infrastructure investments. Both infrastructure investments and rate base continue to grow. Since 2018, we have invested over $2.84 billion in our water and wastewater infrastructure, improving the reliability and sustainability of our service systems. 3 Infrastructure Investment Improves Reliability and Sustainability, Powers Long - Term Earnings (in millions) $272 $274 $299 $293 $328 $384 $471 $517 $0 $100 $200 $300 $400 $500 $600 2018 2019 2020 2021 2022 2023 2024 2025 While earnings can fluctuate during temporary changes in demand or due to the timing of regulatory decisions, our increasing rate base provides a clear long - term measure of the strength and potential earnings growth of the Company for our shareholders. This is reflected in our 10 - year total shareholder return (TSR) of 120.3%, which aligns with the median TSR of the other publicly traded regulated water utilities. $1.24 $1.26 $1.61 $1.87 $2.01 $2.20 $2.39 $2.64 $0.00 $0.50 $1.00 $1.50 $2.00 $2.50 $3.00 2018 2019 2020 2021 2022 2023 2024 2025 Earnings Performance Driven B y Capital Investment/Rate Base Growth (in billions)
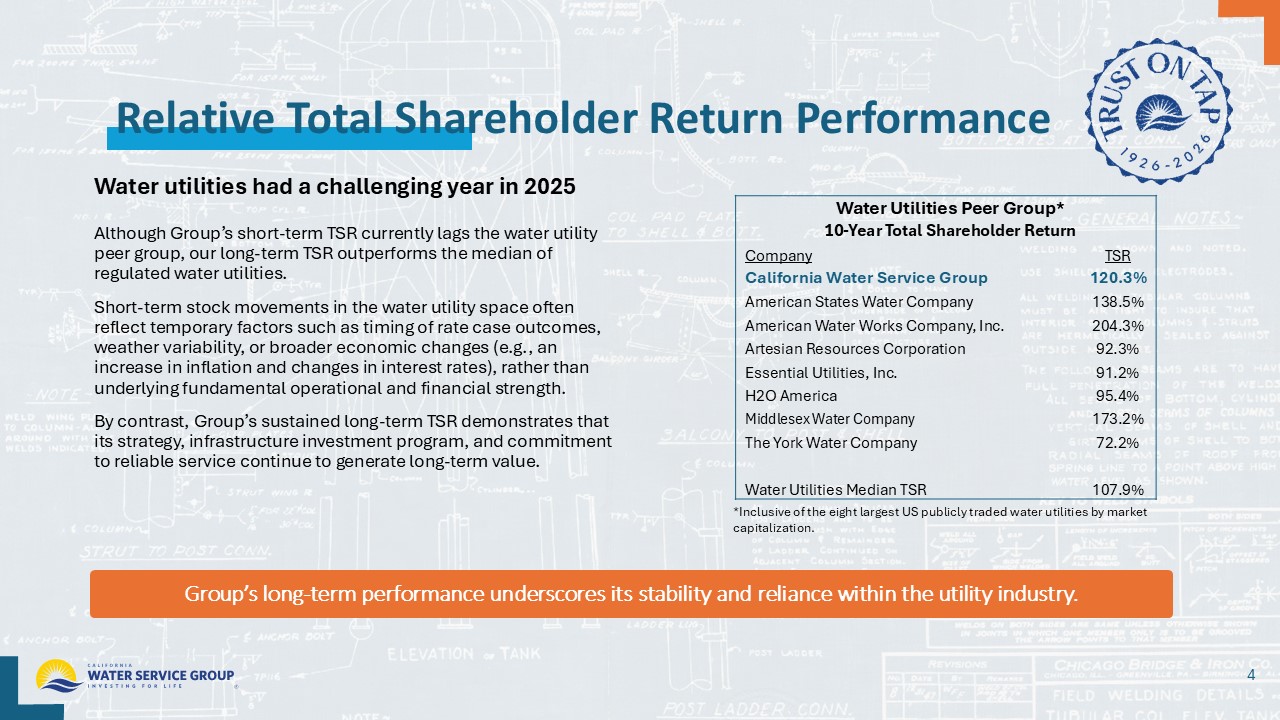
Relative Total Shareholder Return Performance Although Group’s short - term TSR currently lags the water utility peer group, our long - term TSR outperforms the median of regulated water utilities. Short - term stock movements in the water utility space often reflect temporary factors such as timing of rate case outcomes, weather variability, or broader economic changes (e.g., an increase in inflation and changes in interest rates), rather than underlying fundamental operational and financial strength. By contrast, Group’s sustained long - term TSR demonstrates that its strategy, infrastructure investment program, and commitment to reliable service continue to generate long - term value. 4 Water utilities had a challenging year in 2025 Water Utilities Peer Group* 10 - Year Total Shareholder Return TSR Company 120.3% California Water Service Group 138.5% American States Water Company 204.3% American Water Works Company, Inc. 92.3% Artesian Resources Corporation 91.2% Essential Utilities, Inc. 95.4% H2O America 173.2% Middlesex Water Company 72.2% The York Water Company 107.9% Water Utilities Median TSR Group’s long - term performance underscores its stability and reliance within the utility industry. *Inclusive of the eight largest US publicly traded water utilities by market capitalization.
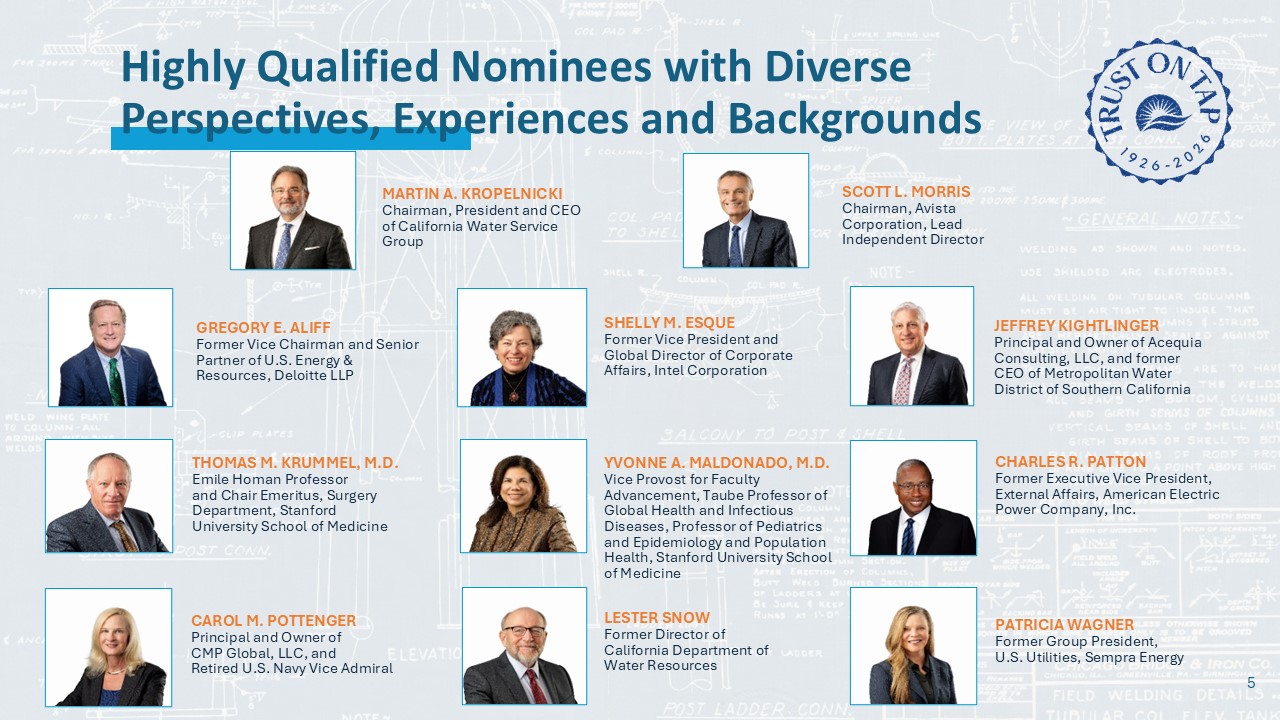
Highly Qualified Nominees with Diverse Perspectives, Experiences and Backgrounds 5 GREGORY E. ALIFF Former Vice Chairman and Senior Partner of U.S. Energy & Resources, Deloitte LLP SHELLY M. ESQUE Former Vice President and Global Director of Corporate Affairs, Intel Corporation MARTIN A. KROPELNICKI Chairman, President and CEO of California Water Service Group THOMAS M. KRUMMEL, M.D. Emile Homan Professor and Chair Emeritus, Surgery Department, Stanford University School of Medicine YVONNE A. MALDONADO, M.D. Vice Provost for Faculty Advancement, Taube Professor of Global Health and Infectious Diseases, Professor of Pediatrics and Epidemiology and Population Health, Stanford University School of Medicine SCOTT L. MORRIS Chairman, Avista Corporation, Lead Independent Director CAROL M. POTTENGER Principal and Owner of CMP Global, LLC, and Retired U.S. Navy Vice Admiral LESTER SNOW Former Director of California Department of Water Resources PATRICIA WAGNER Former Group President, U.S. Utilities, Sempra Energy JEFFREY KIGHTLINGER Principal and Owner of Acequia Consulting, LLC, and former CEO of Metropolitan Water District of Southern California CHARLES R. PATTON Former Executive Vice President, External Affairs, American Electric Power Company, Inc.
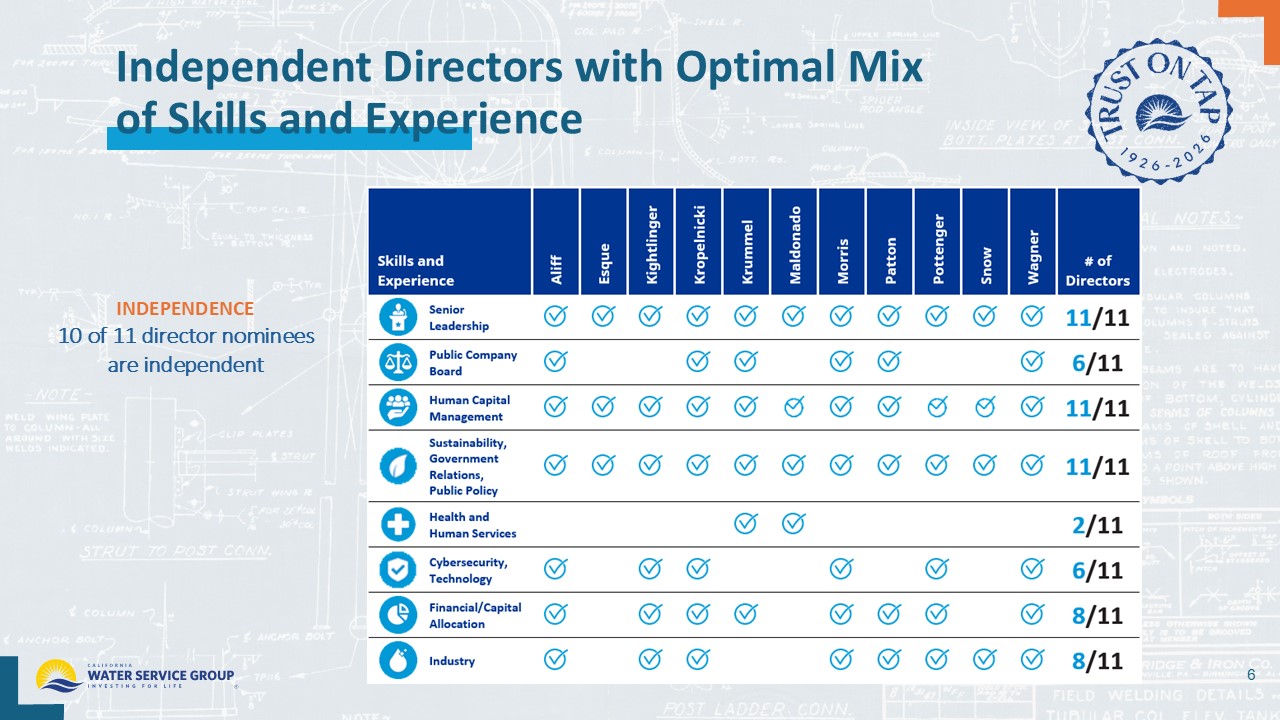
Independent Directors with Optimal Mix of Skills and Experience INDEPENDENCE 10 of 11 director nominees are independent 6
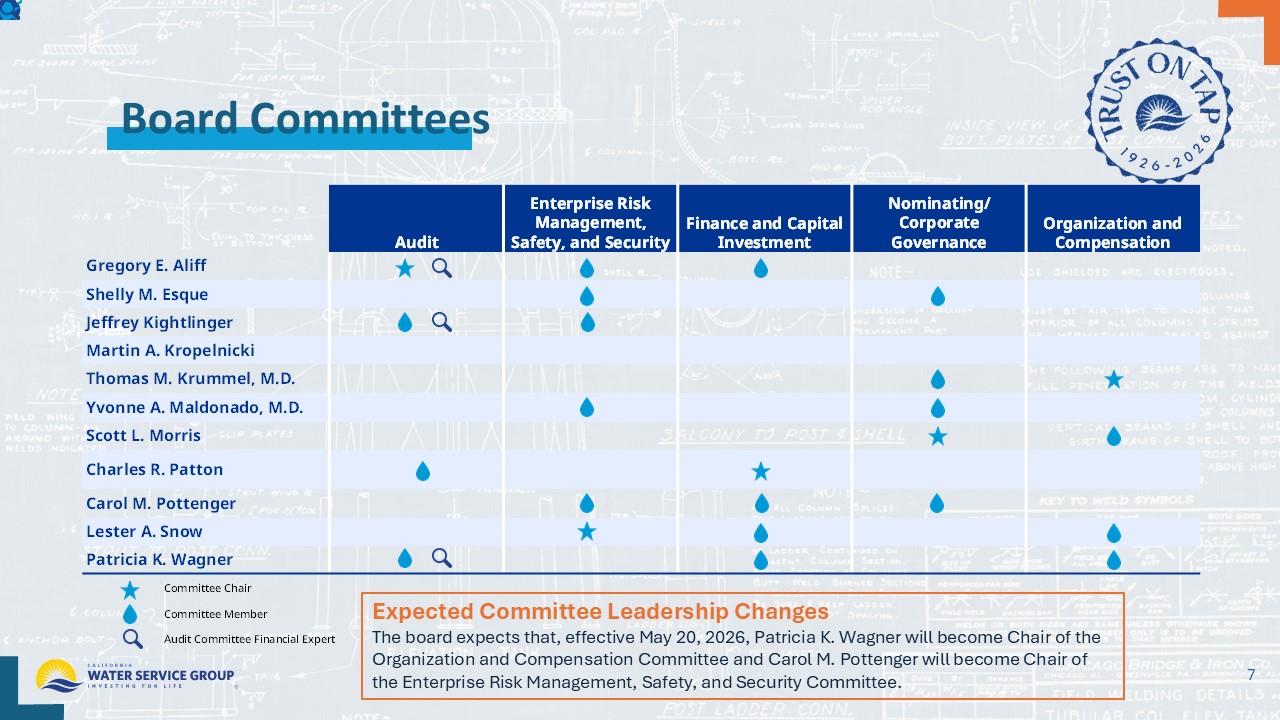
Board Committees 7 Organization and Compensation Nominating/ Corporate Governance Finance and Capital Investment Enterprise Risk Management, Safety, and Security Audit Gregory E. Aliff Shelly M. Esque Jeffrey Kightlinger Martin A. Kropelnicki Thomas M. Krummel, M.D. Yvonne A. Maldonado, M.D. Scott L. Morris Charles R. Patton Carol M. Pottenger Lester A. Snow Patricia K. Wagner Committee Chair Committee Member Audit Committee Financial Expert Expected Committee Leadership Changes The board expects that, effective May 20, 2026, Patricia K. Wagner will become Chair of the Organization and Compensation Committee and Carol M. Pottenger will become Chair of the Enterprise Risk Management, Safety, and Security Committee.
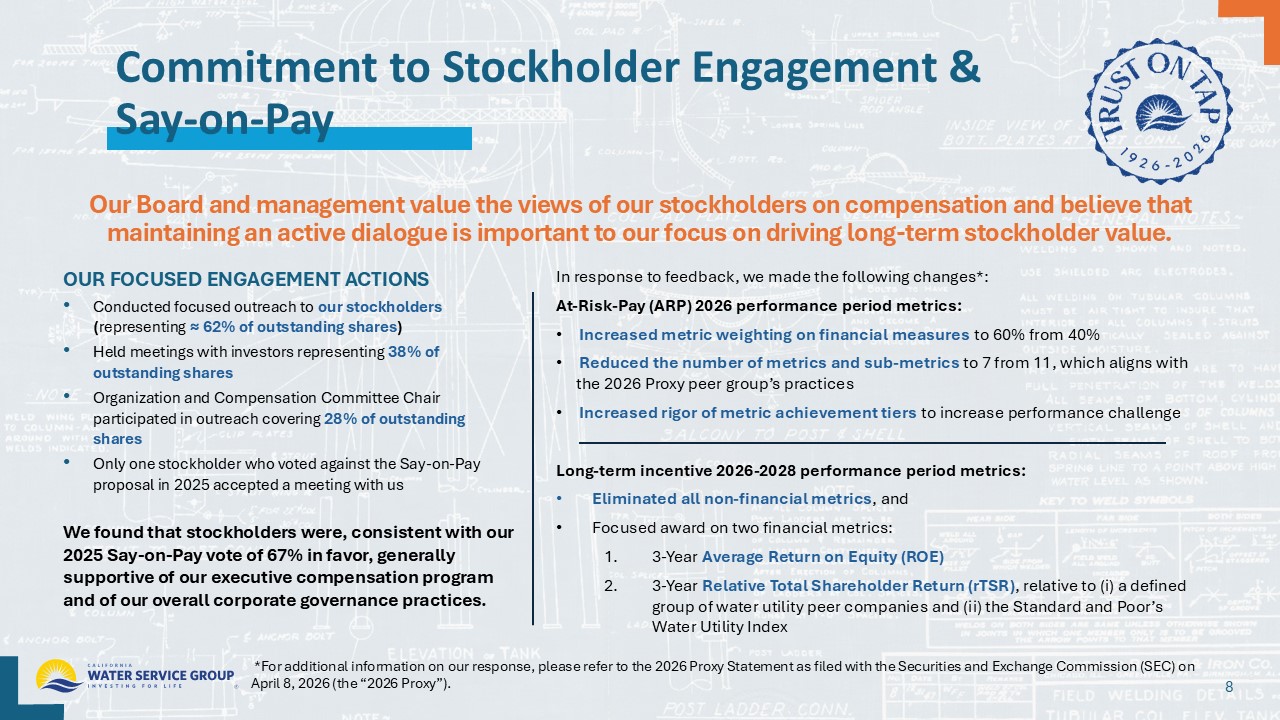
In response to feedback, we made the following changes*: At - Risk - Pay (ARP) 2026 performance period metrics: • Increased metric weighting on financial measures to 60% from 40% • Reduced the number of metrics and sub - metrics to 7 from 11, which aligns with the 2026 Proxy peer group’s practices • Increased rigor of metric achievement tiers to increase performance challenge Long - term incentive 2026 - 2028 performance period metrics: • Eliminated all non - financial metrics , and • Focused award on two financial metrics: 1. 3 - Year Average Return on Equity (ROE) 2. 3 - Year Relative Total Shareholder Return ( rTSR ) , relative to ( i ) a defined group of water utility peer companies and (ii) the Standard and Poor’s Water Utility Index OUR FOCUSED ENGAGEMENT ACTIONS • Conducted focused outreach to our stockholders ( representing ≈ 62% of outstanding shares ) • Held meetings with investors representing 38% of outstanding shares • Organization and Compensation Committee Chair participated in outreach covering 28% of outstanding shares • Only one stockholder who voted against the Say - on - Pay proposal in 2025 accepted a meeting with us We found that stockholders were, consistent with our 2025 Say - on - Pay vote of 67% in favor, generally supportive of our executive compensation program and of our overall corporate governance practices. Commitment to Stockholder Engagement & Say - on - Pay 8 Our Board and management value the views of our stockholders on compensation and believe that maintaining an active dialogue is important to our focus on driving long - term stockholder value. 8 *For additional information on our response, please refer to the 2026 Proxy Statement as filed with the Securities and Exchan ge Commission (SEC) on April 8, 2026 (the “2026 Proxy”).
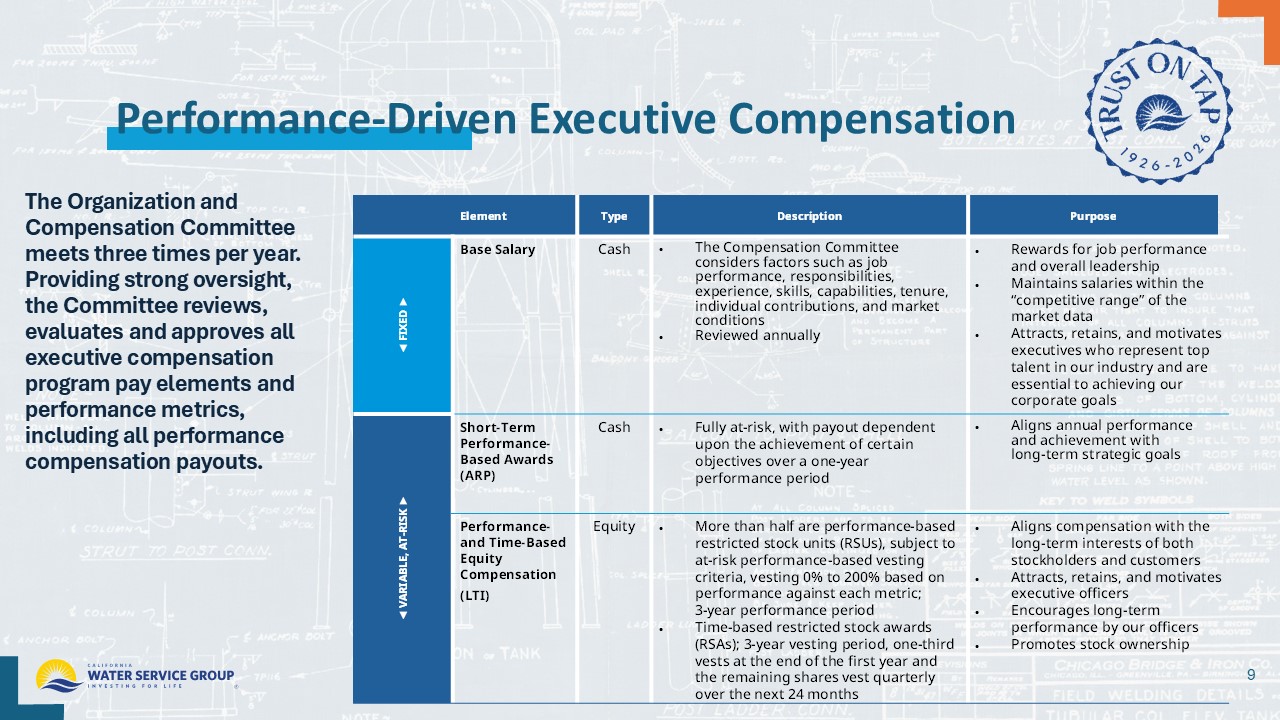
Performance - Driven Executive Compensation 9 The Organization and Compensation Committee meets three times per year. Providing strong oversight, the Committee reviews, evaluates and approves all executive compensation program pay elements and performance metrics, including all performance compensation payouts. Purpose Description Type Element Rewards for job performance and overall leadership Maintains salaries within the “competitive range” of the market data Attracts, retains, and motivates executives who represent top talent in our industry and are essential to achieving our corporate goals The Compensation Committee considers factors such as job performance, responsibilities, experience, skills, capabilities, tenure, individual contributions, and market conditions Reviewed annually Cash Base Salary ◄ FIXED ► Aligns annual performance and achievement with long - term strategic goals Fully at - risk, with payout dependent upon the achievement of certain objectives over a one - year performance period Cash Short - Term Performance - Based Awards (ARP) ◄ VARIABLE, AT - RISK ► Aligns compensation with the long - term interests of both stockholders and customers Attracts, retains, and motivates executive officers Encourages long - term performance by our officers Promotes stock ownership More than half are performance - based restricted stock units (RSUs), subject to at - risk performance - based vesting criteria, vesting 0% to 200% based on performance against each metric; 3 - year performance period Time - based restricted stock awards (RSAs); 3 - year vesting period, one - third vests at the end of the first year and the remaining shares vest quarterly over the next 24 months Equity Performance - and Time - Based Equity Compensation (LTI)
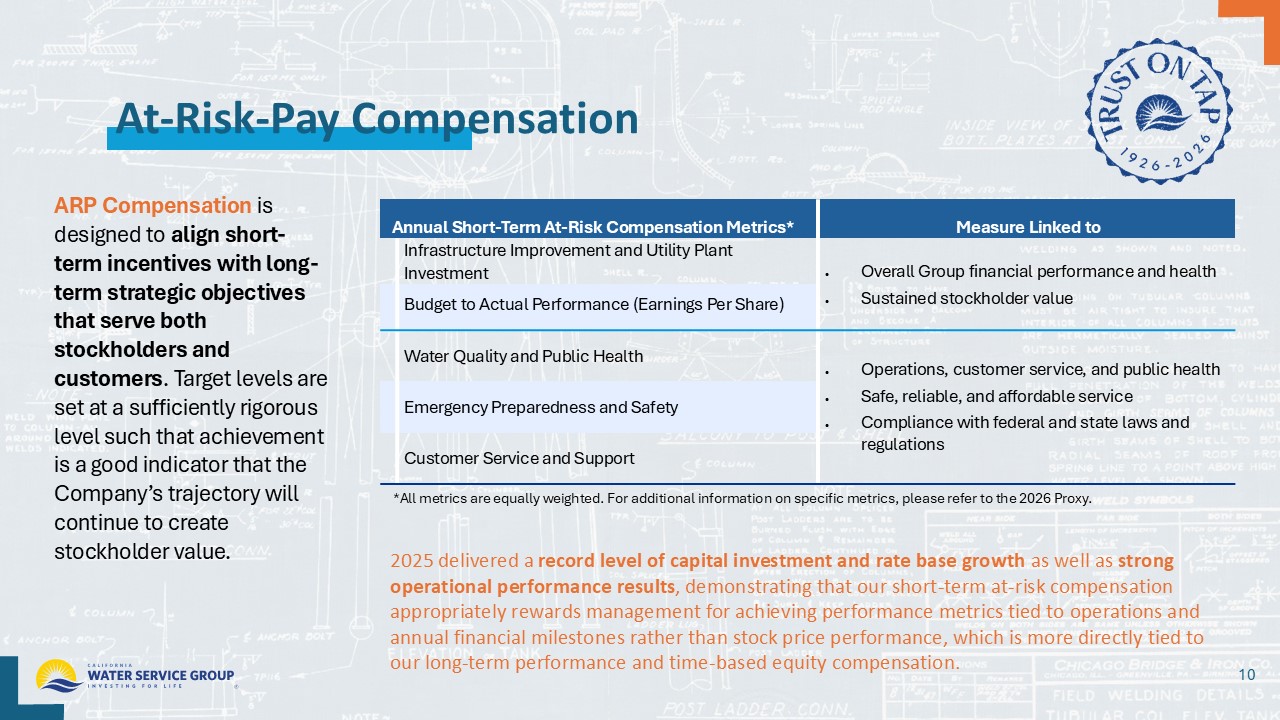
At - Risk - Pay Compensation ARP Compensation is designed to align short - term incentives with long - term strategic objectives that serve both stockholders and customers . Target levels are set at a sufficiently rigorous level such that achievement is a good indicator that the Company’s trajectory will continue to create stockholder value. 10 2025 delivered a record level of capital investment and rate base growth as well as strong operational performance results , demonstrating that our short - term at - risk compensation appropriately rewards management for achieving performance metrics tied to operations and annual financial milestones rather than stock price performance, which is more directly tied to our long - term performance and time - based equity compensation. Measure Linked to Annual Short - Term At - Risk Compensation Metrics* Overall Group financial performance and health Sustained stockholder value Infrastructure Improvement and Utility Plant Investment Budget to Actual Performance (Earnings Per Share) Operations, customer service, and public health Safe, reliable, and affordable service Compliance with federal and state laws and regulations Water Quality and Public Health Emergency Preparedness and Safety Customer Service and Support *All metrics are equally weighted. For additional information on specific metrics, please refer to the 2026 Proxy.
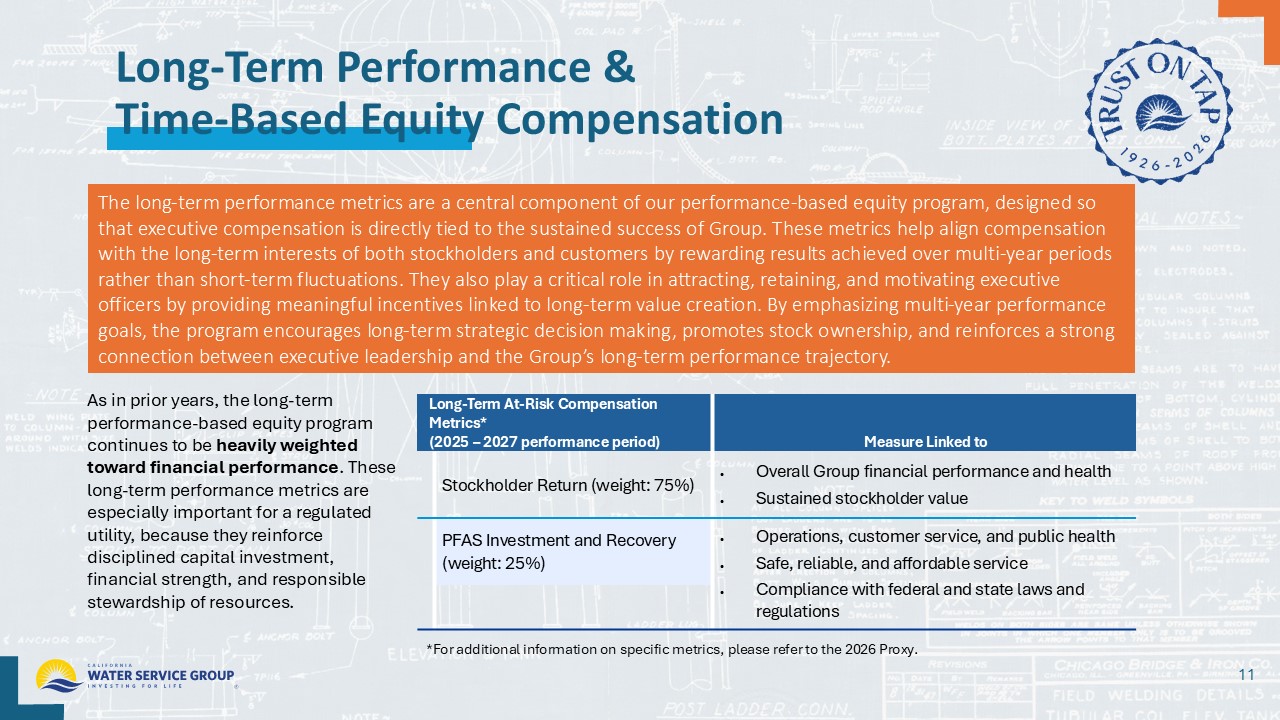
Long - Term Performance & Time - Based Equity Compensation 11 The long - term performance metrics are a central component of our performance - based equity program, designed so that executive compensation is directly tied to the sustained success of Group. These metrics help align compensation with the long - term interests of both stockholders and customers by rewarding results achieved over multi - year periods rather than short - term fluctuations. They also play a critical role in attracting, retaining, and motivating executive officers by providing meaningful incentives linked to long - term value creation. By emphasizing multi - year performance goals, the program encourages long - term strategic decision making, promotes stock ownership, and reinforces a strong connection between executive leadership and the Group’s long - term performance trajectory. Measure Linked to Long - Term At - Risk Compensation Metrics* (2025 – 2027 performance period) Overall Group financial performance and health Sustained stockholder value Stockholder Return (weight: 75%) Operations, customer service, and public health Safe, reliable, and affordable service Compliance with federal and state laws and regulations PFAS Investment and Recovery (weight: 25%) As in prior years, the long - term performance - based equity program continues to be heavily weighted toward financial performance . These long - term performance metrics are especially important for a regulated utility, because they reinforce disciplined capital investment, financial strength, and responsible stewardship of resources. *For additional information on specific metrics, please refer to the 2026 Proxy.
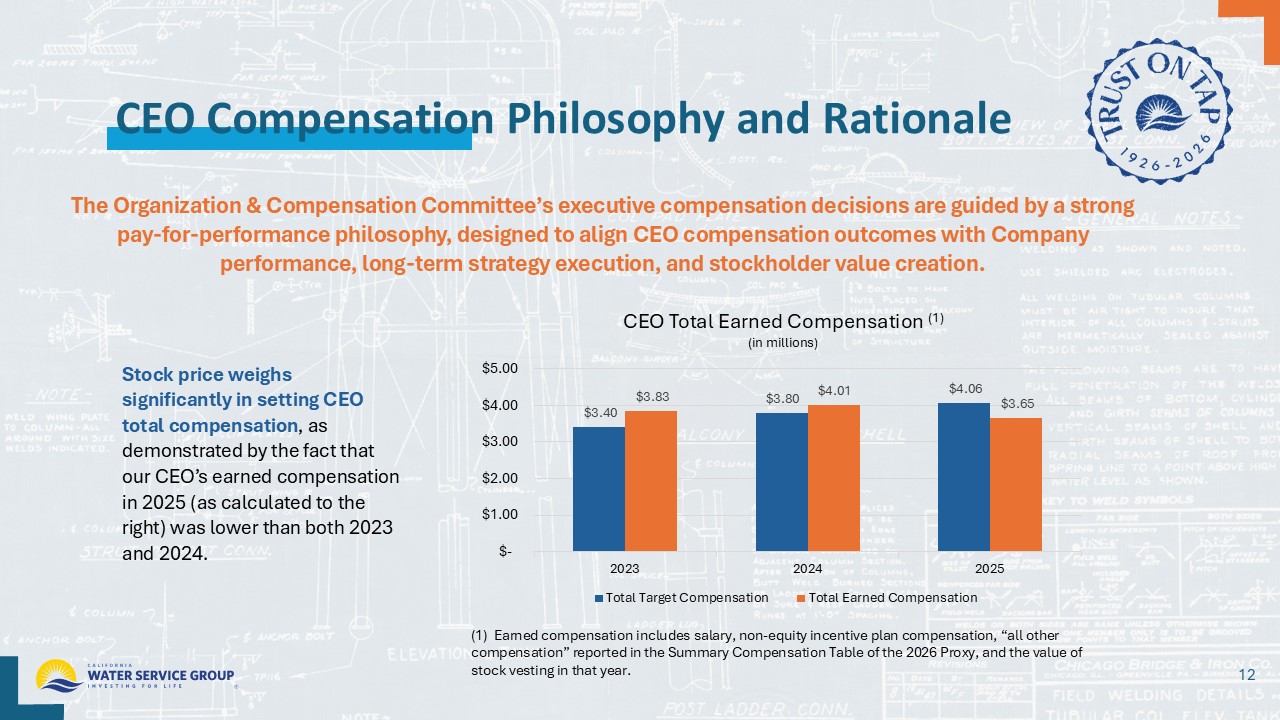
CEO Compensation Philosophy and Rationale The Organization & Compensation Committee’s executive compensation decisions are guided by a strong pay - for - performance philosophy, designed to align CEO compensation outcomes with Company performance, long - term strategy execution, and stockholder value creation. 12 Stock price weighs significantly in setting CEO total compensation , as demonstrated by the fact that our CEO’s earned compensation in 2025 (as calculated to the right) was lower than both 2023 and 2024. $3.40 $3.80 $4.06 $3.83 $4.01 $3.65 $- $1.00 $2.00 $3.00 $4.00 $5.00 2023 2024 2025 CEO Total Earned Compensation (1) (in millions) Total Target Compensation Total Earned Compensation (1) Earned compensation includes salary, non - equity incentive plan compensation, “all other compensation” reported in the Summary Compensation Table of the 2026 Proxy, and the value of stock vesting in that year.
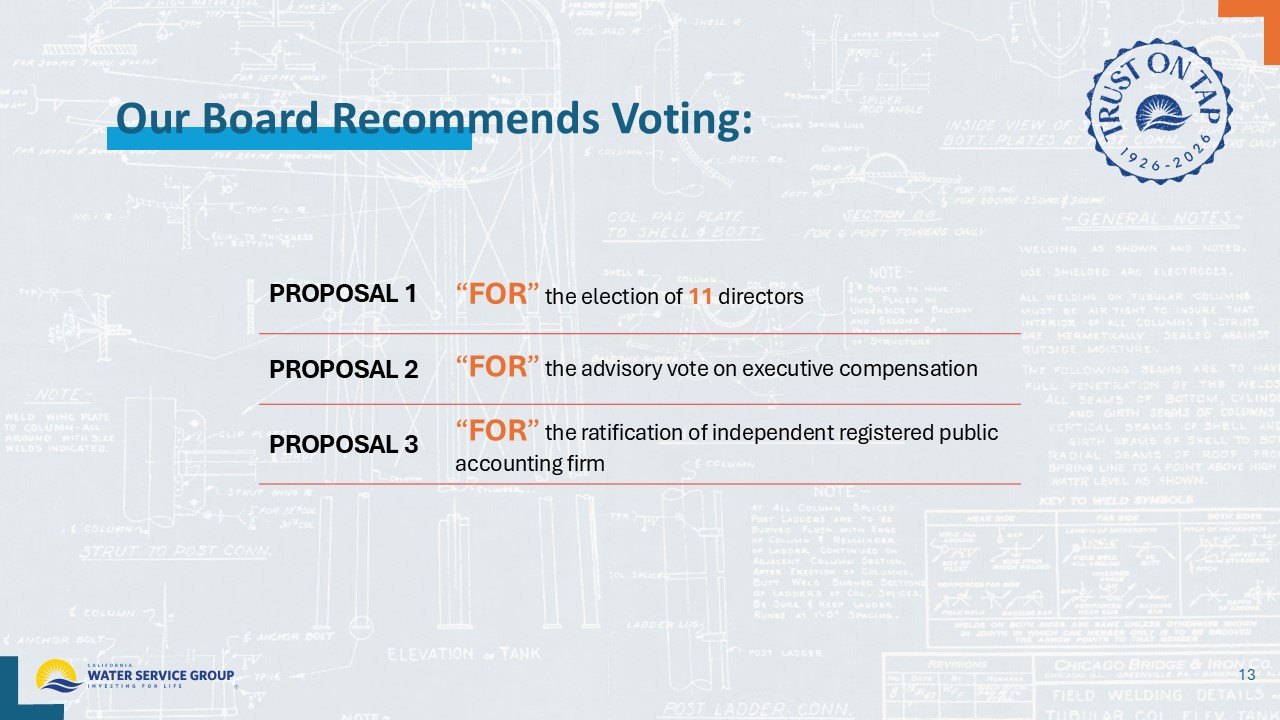
Our Board Recommends Voting: 13 “ FOR ” the election of 11 directors PROPOSAL 1 “ FOR ” the advisory vote on executive compensation PROPOSAL 2 “ FOR ” the ratification of independent registered public accounting firm PROPOSAL 3
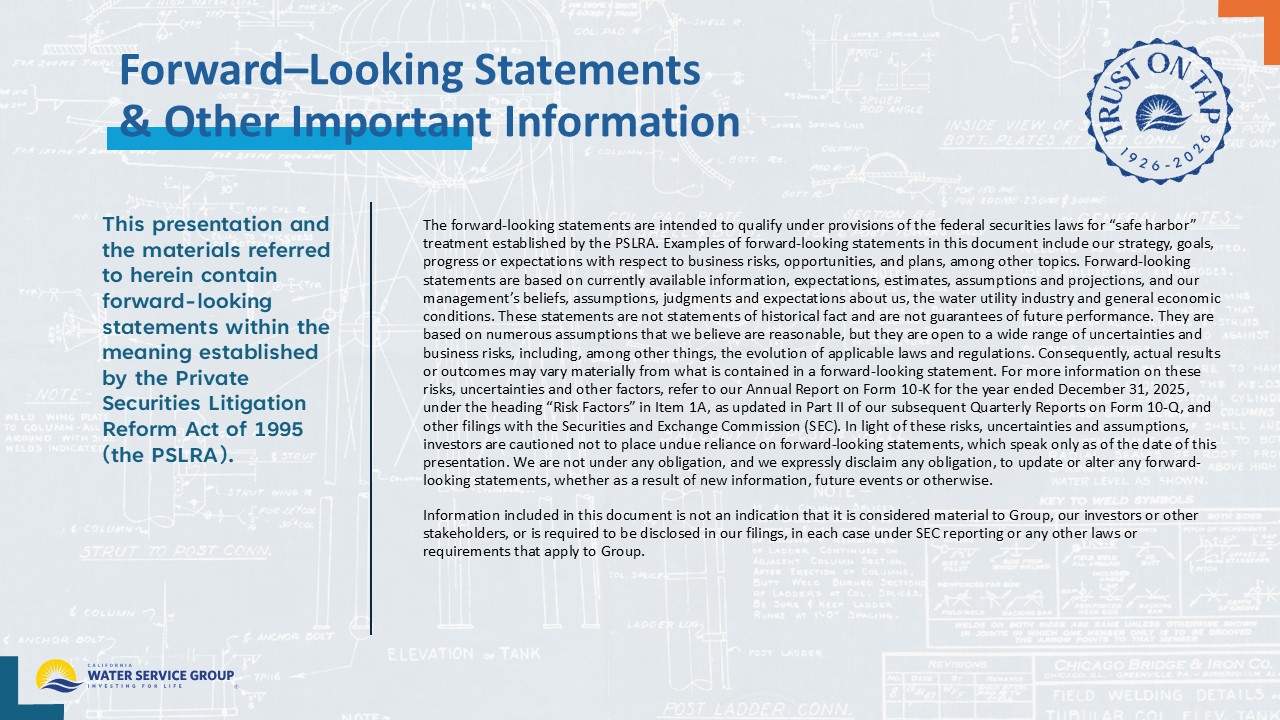
Forward – Looking Statements & Other Important Information This presentation and the materials referred to herein contain forward - looking statements within the meaning established by the Private Securities Litigation Reform Act of 1995 (the PSLRA). 14 The forward - looking statements are intended to qualify under provisions of the federal securities laws for “safe harbor” treatment established by the PSLRA . Examples of forward - looking statements in this document include our strategy, goals, progress or expectations with respect to business risks, opportunities, and plans, among other topics. Forward - looking statements are based on currently available information, expectations, estimates, assumptions and projections, and our management’s beliefs, assumptions, judgments and expectations about us, the water utility industry and general economic conditions. These statements are not statements of historical fact and are not guarantees of future performance. They are based on numerous assumptions that we believe are reasonable, but they are open to a wide range of uncertainties and business risks, including, among other things, the evolution of applicable laws and regulations. Consequently, actual results or outcomes may vary materially from what is contained in a forward - looking statement. For more information on these risks, uncertainties and other factors, refer to our Annual Report on Form 10 - K for the year ended December 31, 2025, under the heading “Risk Factors” in Item 1A , as updated in Part II of our subsequent Quarterly Reports on Form 10 - Q, and other filings with the Securities and Exchange Commission (SEC). In light of these risks, uncertainties and assumptions, investors are cautioned not to place undue reliance on forward - looking statements, which speak only as of the date of this presentation. We are not under any obligation, and we expressly disclaim any obligation, to update or alter any forward - looking statements, whether as a result of new information, future events or otherwise. Information included in this document is not an indication that it is considered material to Group, our investors or other stakeholders, or is required to be disclosed in our filings, in each case under SEC reporting or any other laws or requirements that apply to Group.